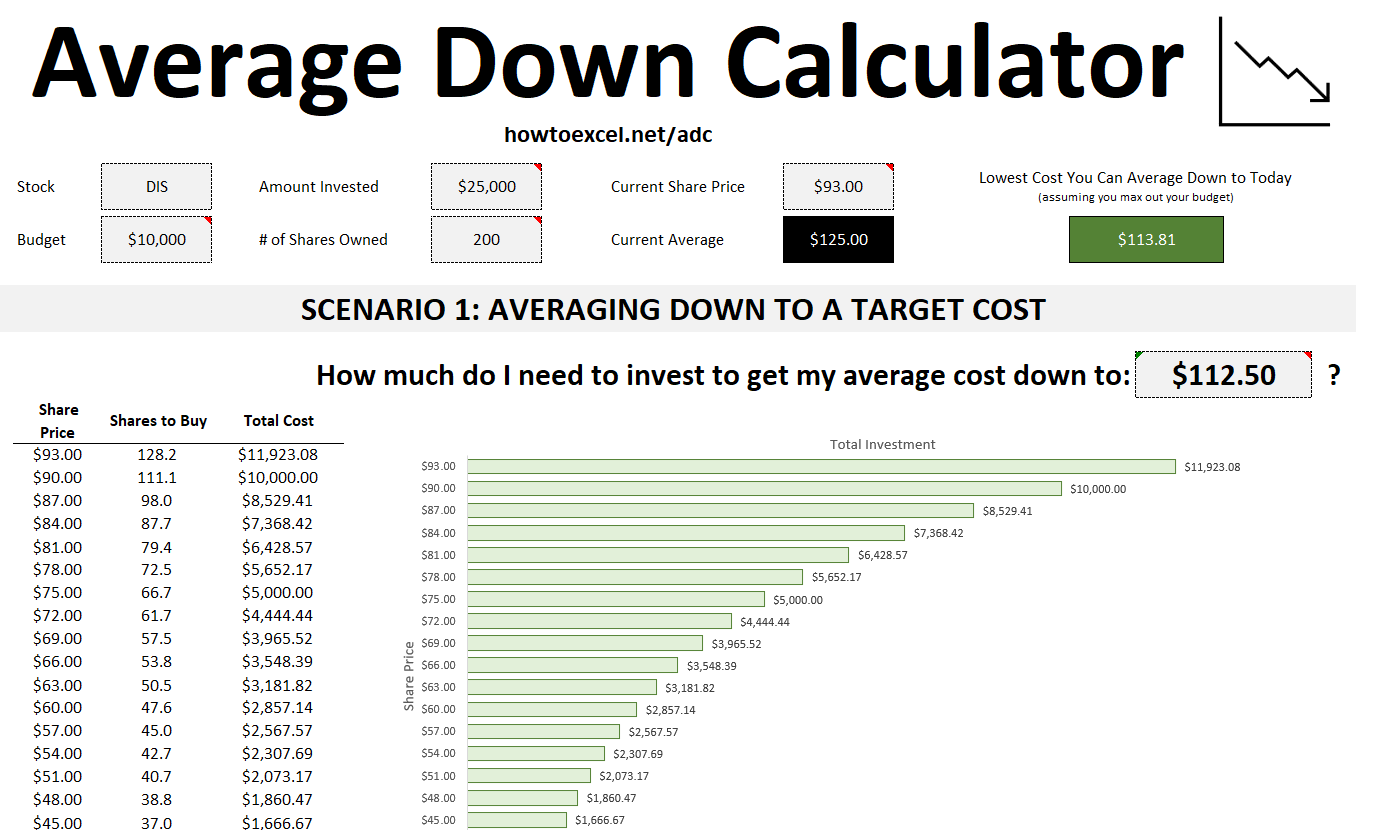
Introducing the Average Down Calculator Spreadsheet – your ultimate tool to strategize stock purchases and optimize your investments in real time. This Excel template simplifies the process of calculating how many additional shares are needed to achieve your ideal average price. With just a few straightforward inputs, this calculator makes it easy to adjust your strategy on the fly.
Here’s how it works:
Key Inputs
- Amount Invested – The total amount already invested in the stock.
- Shares Owned – Your current shareholding.
- Current Share Price – The stock’s latest market price.
- Budget – The amount you’re willing to invest to average down.
Scenarios Provided
Achieve Your Desired Average Price
This scenario calculates the investment needed at various price points to reach your target average price. It generates up to 20 possible points, showing how many shares are required at different prices if the stock price continues to drop.
Optimize for the Lowest Possible Average Price
If you don’t have a specific target average in mind, this scenario lets you see how low your average could go by purchasing shares at the current price. It’s a practical tool for exploring your options and setting realistic goals.
Waiting to Buy at a Different Price
If you want to wait, this scenario shows you what you can average down to if the share price moves by 2% at a time, in either direction.
Download the Average Down Calculator spreadsheet today, and take the guesswork out of averaging down. Whether you have a budgeted investment or a target average price, this template provides clarity, insight, and easy-to-follow visuals to guide you toward your investment goals. If you purchase this template, you will gain access to both the Excel and Google Sheets versions.

