

Crypto coin dominance is a vital metric in the cryptocurrency market, providing insights into the relative market strength of a particular cryptocurrency, compared to the overall market. It reflects the proportion of a specific cryptocurrency’s market capitalization in relation to the total market cap of all cryptocurrencies. This metric is particularly significant for investors as it indicates the level of risk, market sentiment, and the dominance of major players like Bitcoin and Ethereum.
Formula for calculating crypto coin dominance
To calculate crypto coin dominance, you the formula itself is fairly straightforward: divide the market capitalization of the cryptocurrency in question by the total market capitalization of all cryptocurrencies. Market capitalization, in this context, is calculated by multiplying the current price of the crypto coin by its total circulating supply.
For instance, if Bitcoin has a market cap of $700 billion and the total market cap of all cryptocurrencies is $2 trillion, Bitcoin’s dominance would be 35%.
Why is this useful for investors?
Crypto coin dominance helps investors understand the weight of a particular cryptocurrency in the market, aiding in diversification and risk assessment strategies. A high dominance might suggest a more stable investment but with potentially lower growth prospects, while a lower dominance could indicate a more volatile but possibly high-growth opportunity. Additionally, shifts in dominance can signal broader market trends, helping investors to anticipate and react to market movements.
Calculating crypto coin dominance in Excel is a practical way for investors to actively monitor these shifts and make informed decisions. By regularly updating the market cap data for various cryptocurrencies, investors can use Excel to quickly calculate and track changes in dominance, enabling them to identify trends and adjust their portfolios accordingly.
Pulling in crypto market caps into Excel
To calculate coin dominance in Excel, you can use Power Query. Through Power Query, you can pull in the data, and do calculations to determine the dominance percentage.
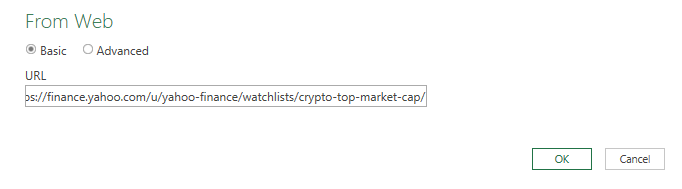
You can find a list of the top cryptos by market cap from the following URL in Yahoo! Finance: https://finance.yahoo.com/u/yahoo-finance/watchlists/crypto-top-market-cap/
To get this data into Excel, take the following steps:
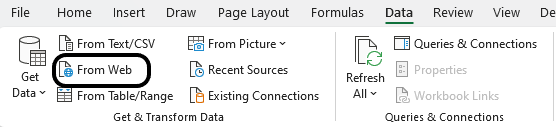
Go to the Data tab and select ‘From Web’
Paste the link the following prompt and click OK.
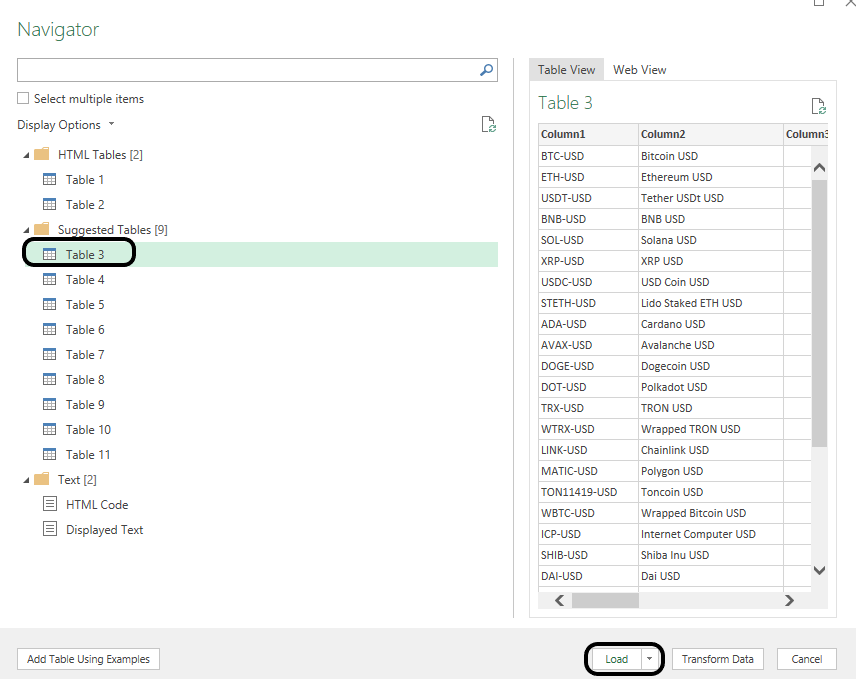
Select the table in Power Query which contains data on the crypto market caps. Then Load the data.
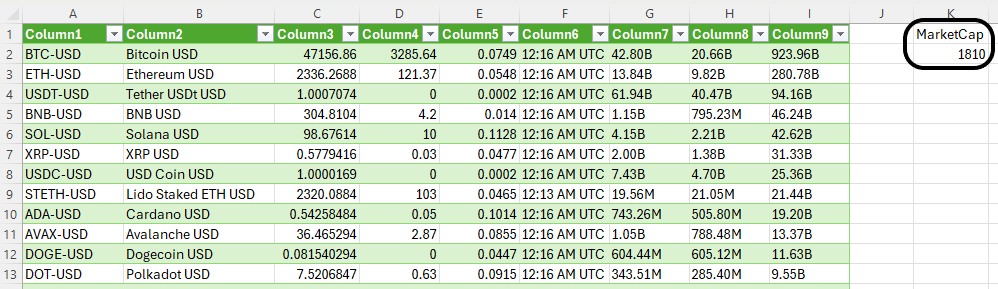
The data is now in Excel but there are no calculations happening just yet. To get this to work, we need the total crypto market cap. The table in Yahoo! Finance didn’t have this information readily available to pull into Power Query. Instead, I’ll leave a place in Excel where the data can easily be entered.
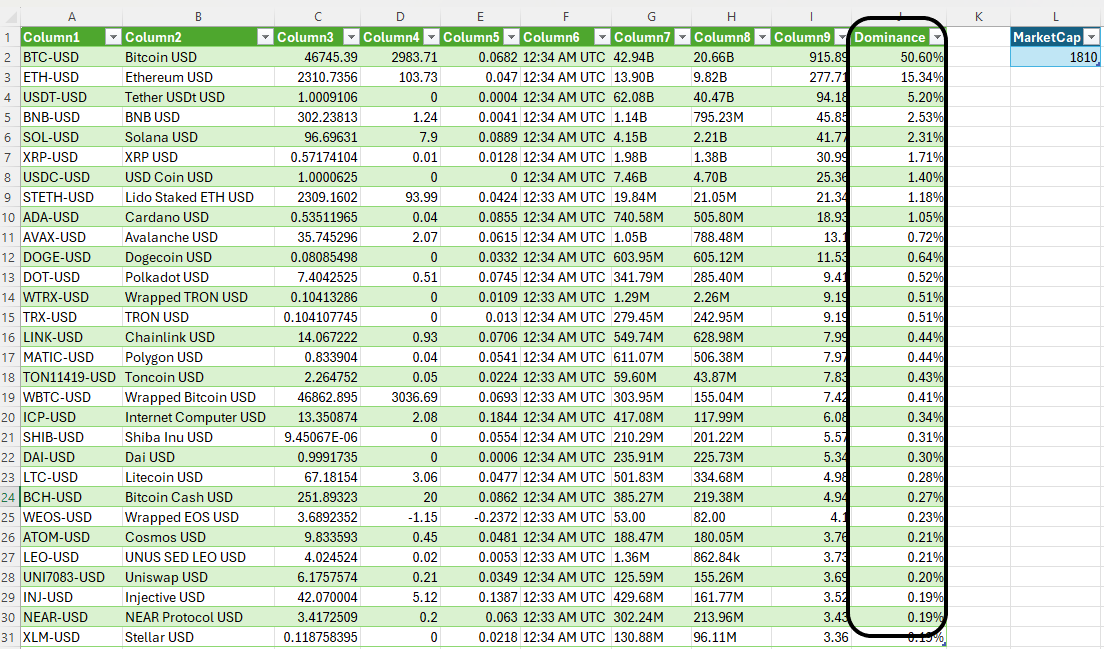
Currently, the crypto market cap is $1.8 trillion. Since the majority of crypto market caps are in billions, I’ll put this in the form of billions, as 1,810.
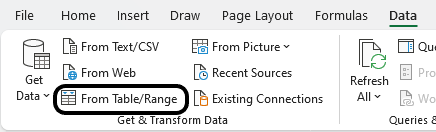
Next, I’ll load this into Power Query. With one of the cells selected, click on the Data tab again, this time, select From Table/Range
In Power Query, I’m going to rename this table MarketCap and the other one as YahooFinance.
Calculating coin dominance in Power Query
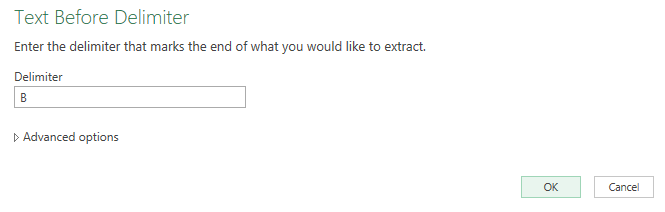
Before I start my calculations, I need to first convert the market caps from the YahooFinance in terms of billions, and remove the ‘B’ that comes after them. Currently, those values are reading as text, and they need to be numbers. In the YahooFinance table, highlight the column which contains the market cap. Then, on the Transform tab, click the Extract option and select Text Before Delimiter

Just enter the letter ‘B’ for the delimiter and press OK on the next screen.
Then, it’s necessary to convert the text into numbers. For that, select the ABC indicator on the header for the market cap, and select Decimal Number for the type.
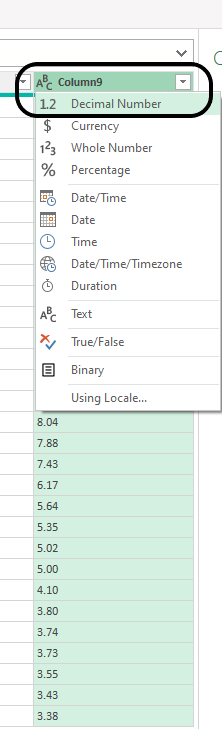
After doing so, the data in the column aligns to the right, indicating the field is a number.
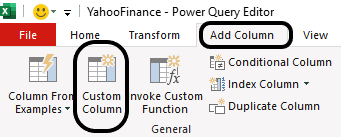
The last part involves creating a new column to calculate the market dominance percentage. For this, go onto the Add Column tab in Power Query. Then, select the option for a Custom Column.
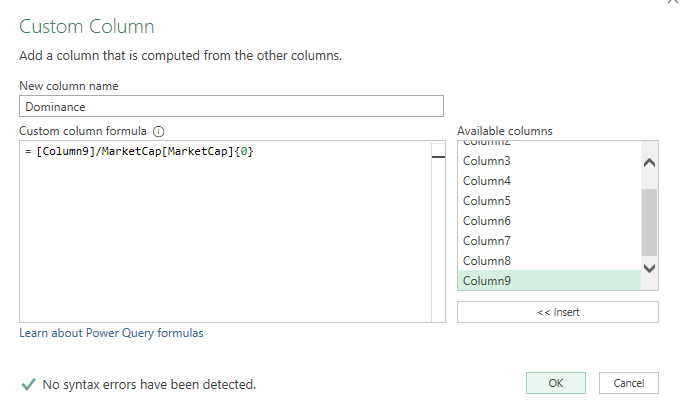
I’m going to name the column ‘Dominance’ and this is where I’ll need to enter my formula. The numerator will be market cap column, which in this case is Column9. I will divide this by the value in the MarketCap table. To reference that value, I need to use the following syntax: MarketCap[MarketCap](0}.
The table is called MarketCap, as is the field name, which is in parenthesis. Since I want the first value in the list, I use {0} since it is a 0-based index. That returns the total market cap I entered of 1,810. To put this all together, this is what the formula looks like in my Custom Column calculation:
After clicking OK, now my dominance column appears. Now I can load the data into Excel. All that’s left is to convert the column into a percentage.
Power Query will create another sheet for the MarketCap, but you can delete that as it isn’t necessary.
Updating the file
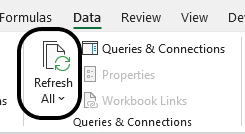
Moving forward, to update the calculations, all you need to do is update the MarketCap value. This is the only value that won’t pull in automatically from the Yahoo! Finance link. Then, click on the Refresh button on the Data tab and Power Query will pull in the updated market caps for the top cryptocurrencies, and then do the dominance percentage calculation.
Ideally, the total market cap could also be pulled in. However, given the vast number of cryptocurrencies, the list in Yahoo! Finance isn’t comprehensive enough; nor is there a table to pull just from market cap. If you do come across a better source for pulling in crypto market caps, let me know!
If you liked this post on How to Calculate Crypto Coin Dominance Using Power Query in Excel, please give this site a like on Facebook and also be sure to check out some of the many templates that we have available for download. You can also follow us on Twitter and YouTube.