You can use Excel to create models, templates, and also to do analysis. This will be the first in a new series of posts to do with Excel-related analysis and how to set up a question and answer it accurately. In this analysis, I’m going to look at how much money you can be losing by letting it sit idle. Specifically, I’ll analyze an investment that pays you a dividend every quarter and look at two scenarios — one where you reinvest dividends back into the stock and one where you don’t. How much of a difference that can make over a 30-year period could surprise you.
At the bottom of the page, I’ll leave the file available for download if you want to take a look at my work and follow along and to see just how much of a difference there is when you don’t reinvest dividends.
Scenario 1: collecting the dividend payments and not reinvesting them
The assumptions and fields
In the simplest scenario, let’s set it up that you don’t reinvest dividends back into the company. To create a template for this in Excel, we’ll need to know the price of the stock, how much you’re investing, and how much the company pays in dividends (which is usually on a quarterly basis), and the growth rate. To keep it simple, we’ll assume the dividend payments will never change and so the amount that you receive in dividends will remain constant.
This is a useful assumption to make when making this type of comparison so that you can isolate one variable, which in this case is whether you reinvest the dividend payments or not. It’s safe to assume if there is a benefit of reinvesting dividend payments, it’ll be even greater if the payouts increase over time, so it’s unnecessary to incorporate dividend growth into the model in order to do this analysis.
I’ll also set the price of the stock at $100, the quarterly dividend at $1.25, and the amount to invest at $10,000. There will be a calculated field to determine the number of shares, which will take the amount invested and divide that by the price of the stock. With a $10,000 investment, you would be able to own 100 shares of a stock that’s priced at $100. I’ll also assume that the stock will rise by 5% every year. These are what my inputs and calculations look like so far:
Setting up the headers
Next, we’ll need to set up the headers for the actual model where the results will be populated. The fields I’ll include are the year, the starting portfolio value, the dividend amount, the cumulative dividend, the ending portfolio value, and the portfolio + dividend.
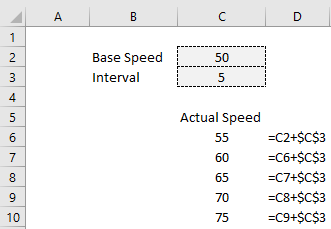
In the year field, I’m just going to increment the numbers 1 to 30 to show the portfolio’s progression over 30 years. You can do this a few different ways. Besides manually entering the numbers 1 to 30 in, you can enter the number 1 in first and then create a formula that just adds one to the number above, and then copy it down. Another option is to enter the values 1 and 2 in the first two rows, select those two cells, and then copy that down. Since you are selecting multiple items, Excel will know the pattern and that you want to increment by 1 each time. Otherwise, just trying to copy 1 down will give you a series of 1’s. For some examples of how this works, check out this post on how to autofill data in Excel.
For the starting portfolio value, I will just link to the initial amount invested and in subsequent periods this will be equal to the previous year’s ending portfolio value.
To calculate the dividend amount, all I need to do here is enter the number of shares, multiply them by the quarterly dividend, and then multiply that by 4, since the payments are quarterly. My formula looks as follows in the first cell:
=$C$7*$C$3*4
$C$7 is the number of shares and $C$3 is the quarterly dividend. Since I’m not reinvesting any dividends, my amount invested will remain the same and that also means that I won’t collect more dividends (since I’m assuming the dividend rate will remain unchanged). This means that every year, I’m expecting to collect $500 in dividend income as I’m taking 100 shares, multiplying them by $1.25 and then by 4 payments.
The cumulative dividend field is an easy calculation as it’s just adding the total of all the dividend payments. You can calculate the cumulative value by using the SUM formula, freezing the first cell, but not the last one. In cell D12, my formula looks as follows:
=SUM($C$12:C12)
My dividend payments are in column C. While the first cell is frozen, the second one is not and the calculation will expand as I copy this formula down.
The ending portfolio value is calculated by taking the starting portfolio value and multiplying it by the growth factor — which in this case is 5%.
The last formula is the portfolio + dividend calculation. This will tell me what the total value of my investment is after factoring the growth in share price as well as all the dividend income I’ve collected over the years. This is a simple calculation of just adding the ending portfolio value (in column E) with the cumulative dividend in column D).
With all of my formulas copied down, this is what my values look like over the 30-year period:
The dividend payments total $15,000 after 30 years and the portfolio will rise to a value of $43,219.42 by the end of the period. Combined, the value of this investment is $58,219.42 when adding the dividend income on top of all the growth the stock is expected to achieve over the years.
Now, let’s switch over to the other scenario, where you reinvest dividends to buy more shares of the company.
Scenario 2: reinvesting the dividend income
This scenario will be more complicated because now the number of shares owned will change every year if you were to reinvest the full amount of dividends you earn.
I’ll need to make some changes to the structure of the template. First, I’ll want to track the number of shares that are owned over the years as that will determine how much dividends will be collected. I’ll also need to calculate the expected stock price to determine how many additional shares I can buy with the dividend income. And I also won’t need the cumulative dividend since the payments will be reinvested back into the stock.
The stock price field will rise by 5% each year and its formula will be simple as it will just rise by the growth rate. As for the number of shares, that will start with the initial purchase of 100 shares and then in future periods it will take the dividend amount and divide it by the stock price to determine the number of additional shares that can be purchased. The dividend calculation will then take the number of shares, multiply it by the quarterly dividend and then again by 4 quarters
With those changes, here’s what the model looks like if the dividend income is reinvested:
At $92,169.05, you’re making $33,949.62 more by reinvesting the dividend back into the stock. This, of course, assumes that the stock will continue to grow at a rate of 5% and that you’ll do nothing with that dividend income but let it sit in the first scenario. But the point is still the same: the cost of letting money sit idle can be significant. In the second scenario, your portfolio will be worth 58% more than it would be in the first scenario.
Now, if you were to invest the dividend income from the first scenario into other investments, then the difference would likely be smaller. However, for the purpose of this analysis, it’s clear that there’s a big advantage of reinvesting dividend income. One variable that wasn’t considered in this analysis is the discount that companies sometimes offer investors when reinvesting dividend income, which could result in more shares and greater returns over the long term under the second scenario. But again, for the sake of simplicity, that was left out but it’s an example of another reason why reinvesting dividend income can be very beneficial.
Proving out the variances
The last part of this analysis involves proving these differences out, comparing when you reinvest dividends versus when you don’t. This is an important part in order to show where the variances came from and to illustrate that the calculations are correct.
Two key areas that contribute to the differences between these two models are the loss of dividend income by not holding more shares and also the loss of portfolio value by not benefiting from the full incremental growth each year.
To do this, let’s create another table that summarizes the variances. The first field here will be the portfolio change, which will just look at the difference in portfolio values between the two models in each year.
Next, the loss of growth column will calculate how much growth is lost by not reinvesting the dividend income. This is calculated by taking the difference in starting values and multiplying that by the growth factor of 5%. Since the dividend income isn’t reinvested, the starting portfolio value will be lower in the first scenario, which means the amount of growth earned will be less than under the second scenario.
The loss of dividend income is the next source of variation because with fewer shares in the first scenario, that will mean less dividend income. To calculate this variance, we’ll need to take the difference in the number of shares and multiply that by the quarterly dividend and by 4, for the number of payments during the year.
Lastly, there is a field for the cumulative loss, which is important as it’s a running total of the losses from dividend income and growth. This should match up the total portfolio change field, and I’ve added a check column to calculate the difference and ensure everything nets out to zero.
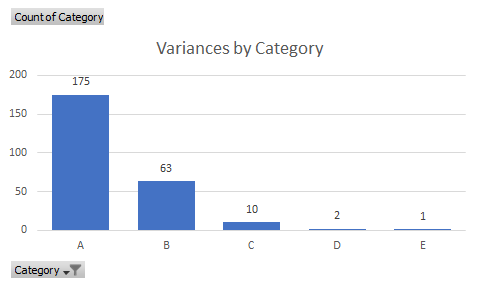
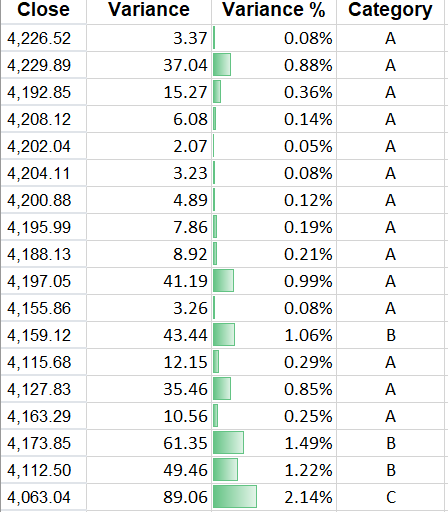
Here’s what the variance table looks like:
As you can see, the bulk of the losses originate from the loss of growth as the impact of compounding can significantly affect your overall returns over the long term when you don’t reinvest dividends.
To see this file in more detail, you can download it from here.
If you liked this post on whether you should reinvest dividends or not, please give this site a like on Facebook and also be sure to check out some of the many templates that we have available for download. You can also follow us on Twitter and YouTube.