

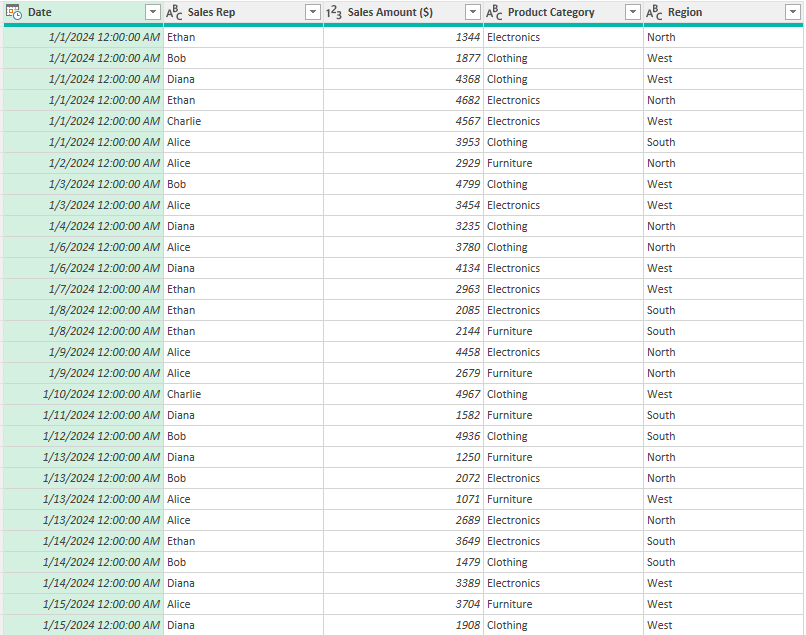
Have data in Power Query that you want to sum up and group by category? In this post, I’ll show you how you can sum up values in Power Query to help you analyze your information. In this example, I’m going to use daily sales values by different sales reps.
Getting a simple sum
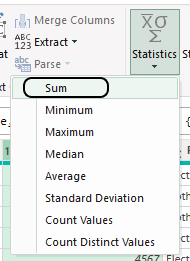
If you just want to calculate a sum in Power Query, select the column you want to sum, and then on the Transform tab, select Statistics, and select Sum.
This will create a new step, where it will calculate the sum.
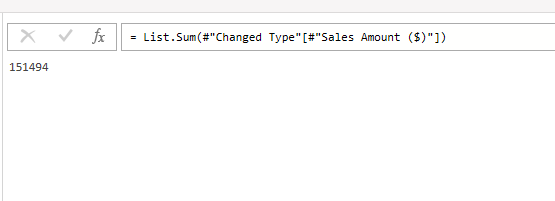
You could reference this step in other calculations. However, if you want to tally up sales by categories, there’s a better way to do this.
Summing values using Group By
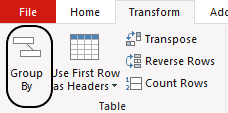
One way to both group and summarize your totals is by using the Group By method. To do this, select the column you want to group by. In this case, it’s going to be by the sales rep, since I want to see the total sales by rep. Then, on the Transform tab, I’ll click on the Group By button:
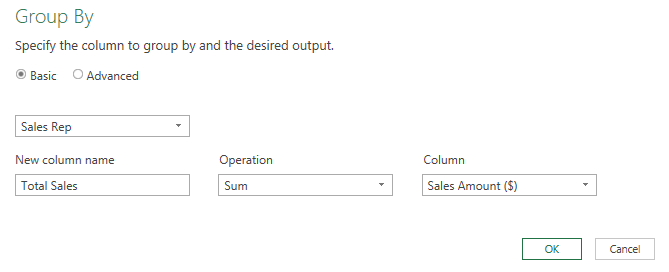
Then, I’ll enter a column name of Total Sales and for the operation, select Sum and select Sales Amount ($) as the column I want to sum.
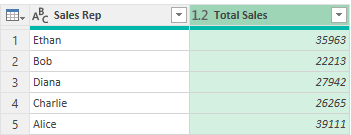
After pressing OK, I have a breakdown of sales by the different reps.
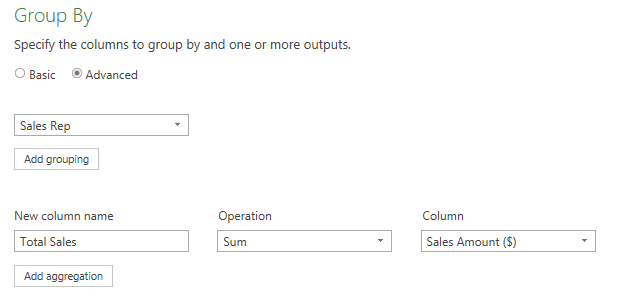
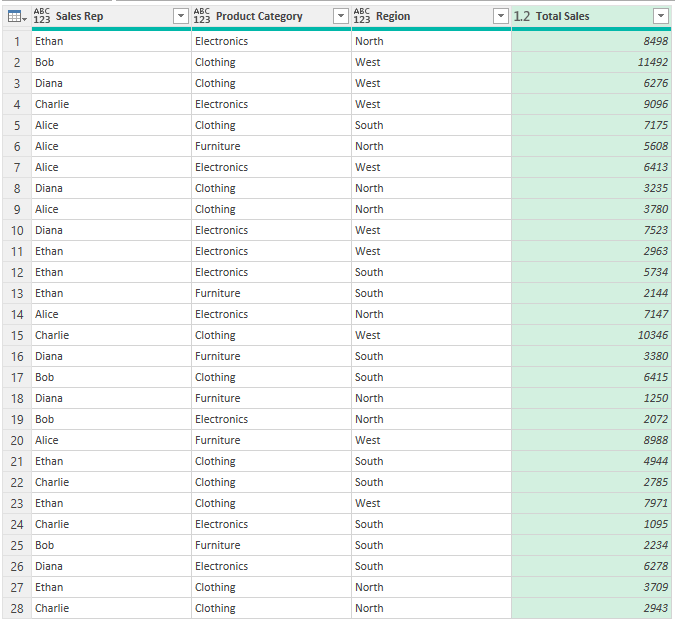
There are, however, more splits that you could do. Suppose you wanted to group sales rep sales by the type of product that was sold and the region. To split into more categories, select the Advanced option in the Group By dialog box. From there, you’ll have the ability to specify more levels to break sales down by.
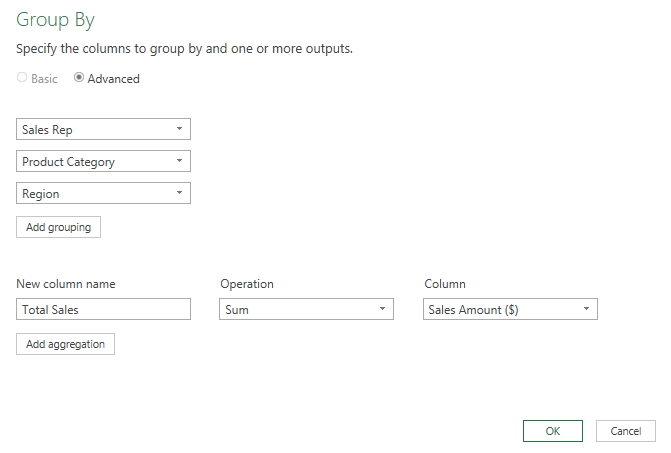
I can click on Add grouping to add more layers, such as Product Category and Region.
Now I have summations based on those different splits.
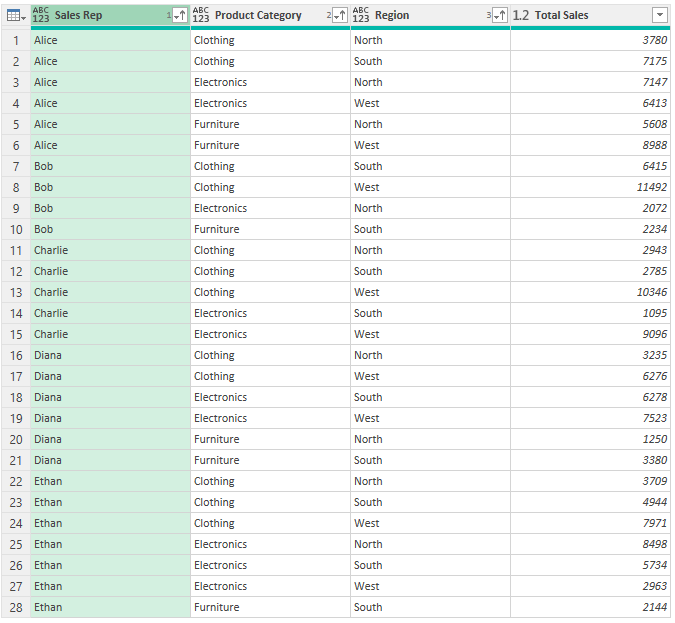
One thing you may still want to do at this point is to organize the data so that it is in some sort of order. To apply a sort, select the column you want to sort by and on the Home tab, indicate whether you want it to be in ascending or descending order. In the below example, I have arranged the data by sales rep, then product category, and then by region.
If you liked this post on How to Sum and Group Values in Power Query, please give this site a like on Facebook and also be sure to check out some of the many templates that we have available for download. You can also follow us on Twitter and YouTube.