

Do you have year-to-date values and need to calculate running totals? What about if you have criteria you want to track running totals for? In this post, I’ll show you how to accomplish both and how you can create a custom function in Power Query that you can re-use in other queries. Here is a simple table I am going to use for this example:
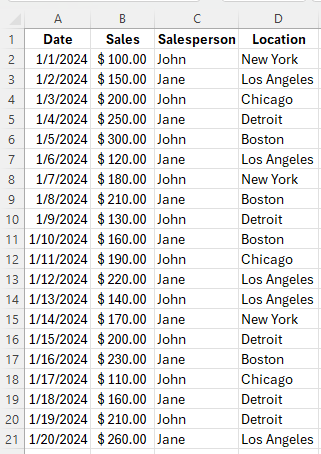
In this table we have date, sales, salesperson, and location. Initially, I am just going to calculate the running total, regardless of the salesperson. I just want to know how much everyone has generated up to a certain point in time. The one step that I need to do is sort the dates in order, so they are going from smallest to largest. You can do this in either Excel or within Power Query.
Creating a running total for everything in Power Query
Step 1: Load your data into Power Query
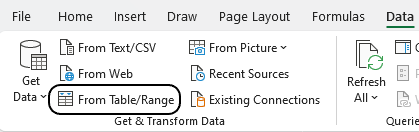
To load your existing table into Power Query, click on your table and select the Data tab and click on From Table/Range.
Step 2: Sort your data
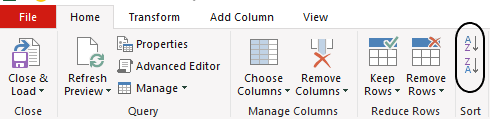
If your data is not already sorted in Power Query, then select the Date column and click the button to sot in ascending order.
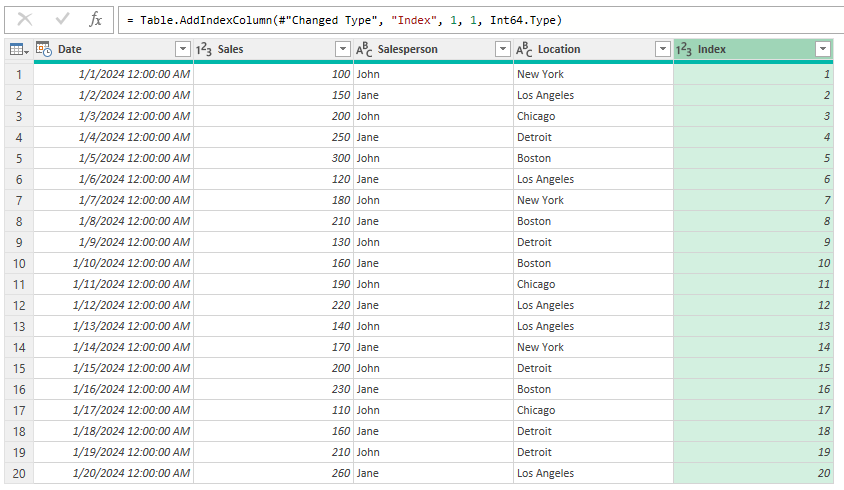
Step 3: Create an Index column
On the Add Column tab, select the option to insert an Index Column, and select to the option to start From 1:
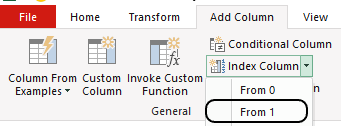
This now creates a simple column that starts from 1.
Step 4: Create a column for the Running Total calculation
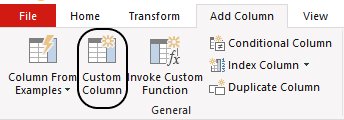
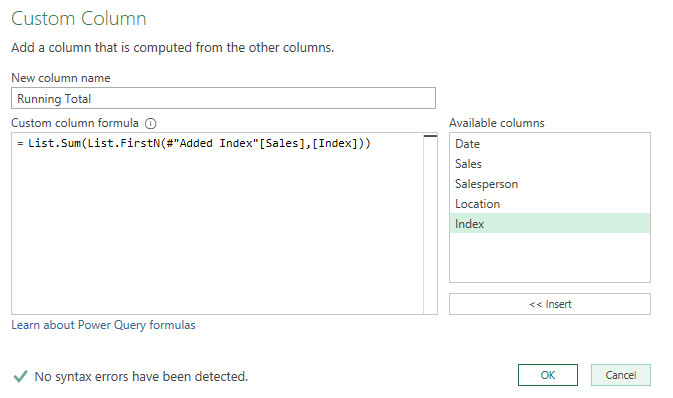
Select the Custom Column button from the Add Column tab, which will let you create a column based on a formula.
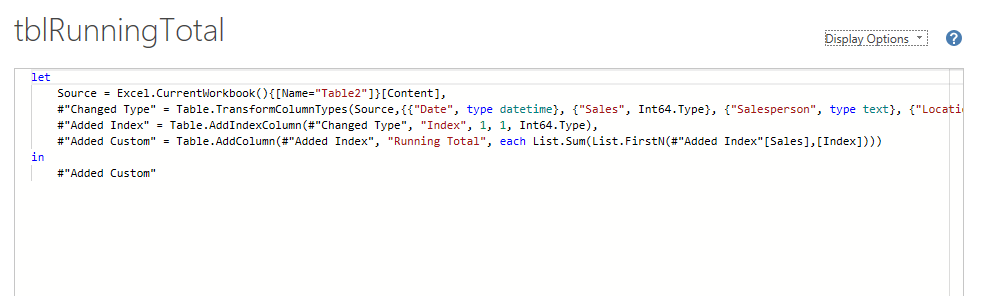
There are two functions will be used in the formula. The first is the List.Sum function, which as the name describes, will sum up the values in a list. Within that will be the List.FirstN function which will grab all the index values up until that point. The custom column formula to enter, is as follows:
=List.Sum(List.FirstN(#"Added Index"[Sales],[Index]))
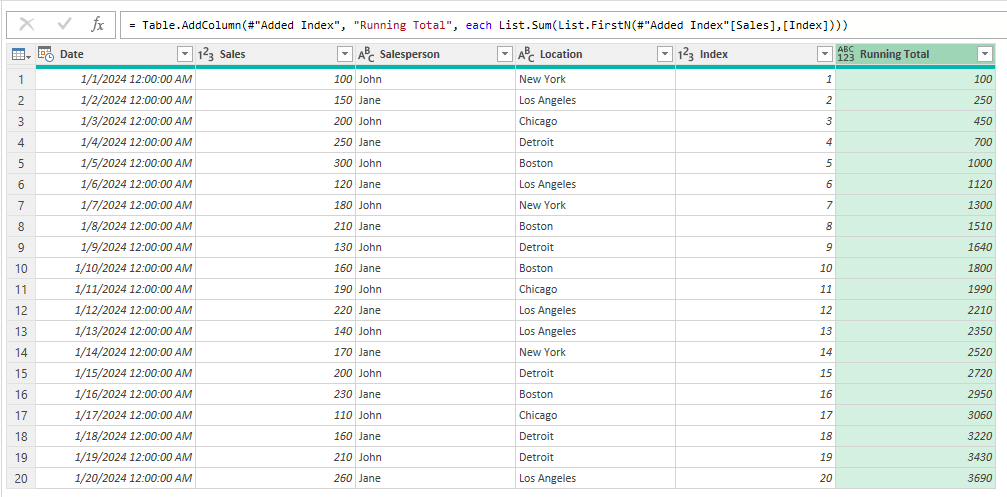
This is how it appears within the Power Query screen:
This now creates a Running Total column which calculates the year-to-date sales values:
Creating a running total for when criteria is met in Power Query
This time around, I’m going to show you how to create a running total which resets for each salesperson. By doing this, you can track their individual year-to-date totals. If you’re starting from scratch, you will need to repeat the steps from the previous section in order to arrive at your Running Total formula.
Step 1: Convert the Running Total formula into custom function
Once you have created the Running Total formula, you can convert it into a custom function. If you select the query and click on the Advanced Editor button on the home tab, you will see the code for all the steps which were previously created:
To reuse this code and use it as a function, I need to add a place to enter a variable at the beginning.
let runningtotal = (x) =>In the above example, x is the input. It will refer to the table which the custom function will execute on. And at the end of the custom function, there should be another ‘in’ keyword to circle back to the function, such as follows:
in runningtotal
Here is how my custom function looks like after removing the Changed Type step and setting the source equal to the variable:
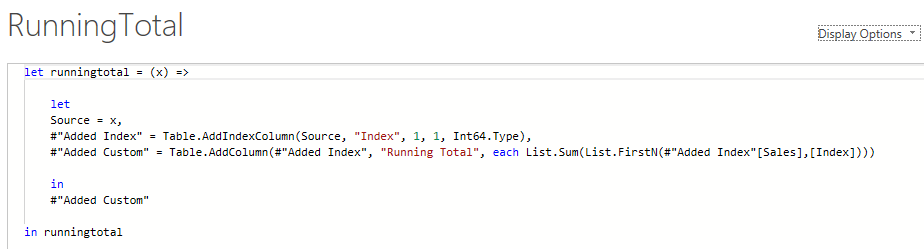
If you remove any steps, however, just remember to update the formulas. In the “Added Index” step, I updated the step I’m referencing to Source. Otherwise, it would reference a step that doesn’t exist and would result in an error.
After saving, you should notice an fx function next to your query, which you may want to now rename to your desired function name. This is what you will reference it to when invoking the function. In this example, I’m going to call it RunningTotal to keep everything consistent.
Now the function is ready to be used.
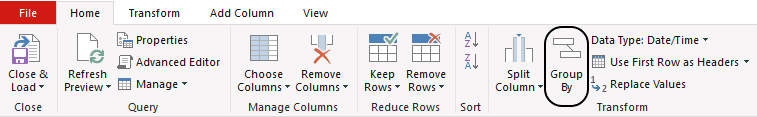
Step 2: Group the data
On the Home tab, select the Group By button. This will allow you to break your data into multiple tables.
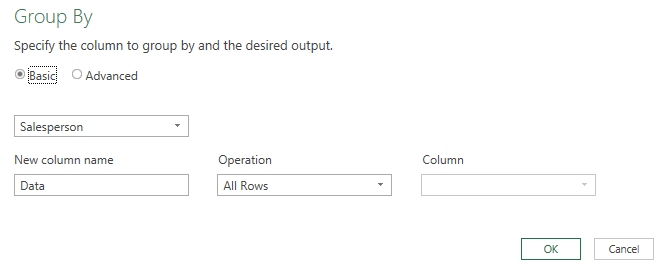
In the Group By section, select the option to group by Salesperson and use All Rows as the operation, which ensures no data is lost. I’ll name the new column Data.
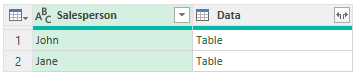
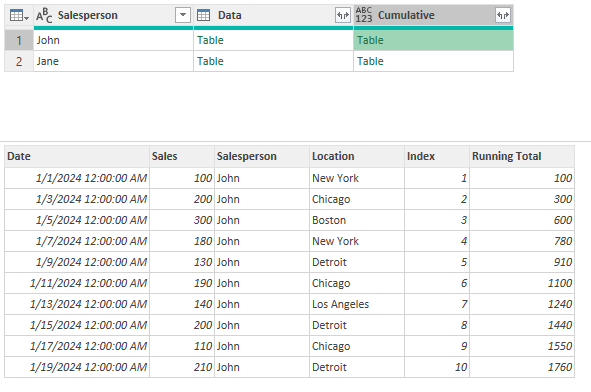
This now creates a column that contains tables based on the salesperson:
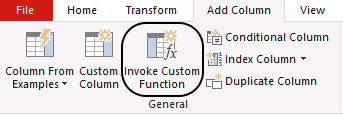
Step 3: Invoke the custom function
On the Add Column tab, press the button to Invoke Custom Function
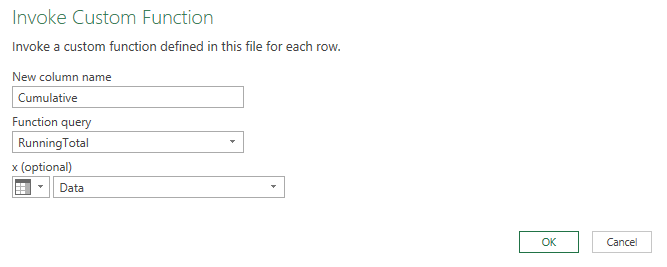
Then, on the details, enter the column name, the function to invoke, and the data which contains the variable. Since the new ‘Data’ column contains the table, that will be the variable in this example. But if you named the column differently, you would use that name.
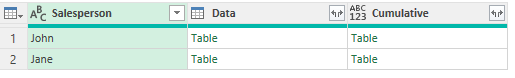
This will now create an additional column, which also contains a table.
If you click on any of the cells in the newly created field, you’ll see that the preview contains the running total field:
Step 4: Expanding the table
The last step involves expanding the tables in the newly created field. By pressing on the two arrows going in opposite directions, you will be able to expand all of the columns.
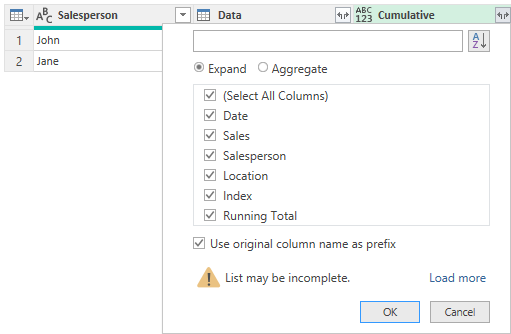
You can omit including the Index column as that is not necessary, and the Salesperson field is already there. The only other column you may want to remove in addition to this is the Data column, but that has to be removed with an additional step. Here is how my final table looks:
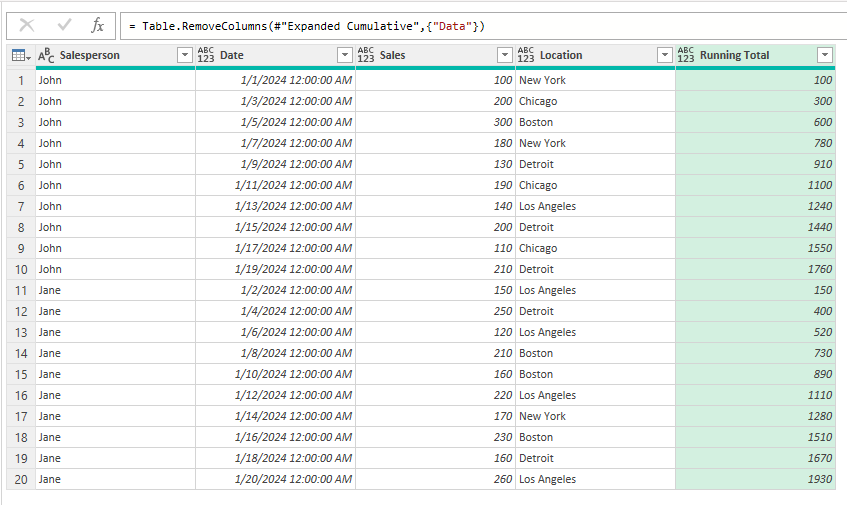
You can see that as the name changes to a different salesperson, the running total doesn’t continue adding; it starts from the first date for that salesperson.
If you liked this post on How to Calculate Running Totals in Power Query, please give this site a like on Facebook and also be sure to check out some of the many templates that we have available for download. You can also follow us on Twitter and YouTube.