

What is the PEG Ratio?
The Price/Earnings to Growth (PEG) Ratio is a metric that enhances the traditional price-to-earnings (P/E) ratio by incorporating the company’s earnings growth rate into the calculation. This ratio is calculated by dividing the P/E ratio by the annual earnings per share (EPS) growth rate.
This calculation provides a more nuanced view of a stock’s valuation by factoring in future earnings growth, offering a more comprehensive perspective compared to the P/E ratio alone, which only considers the current price relative to earnings.
Why Investors Find the PEG Ratio Useful
Investors use the PEG ratio for several reasons. It allows for a more balanced comparison between companies with differing growth rates. A high P/E ratio might suggest a stock is overvalued, but when accounting for strong anticipated growth (as the PEG ratio does), the stock might actually be undervalued. This makes the PEG ratio a favored tool for identifying stocks that might offer a better return on investment, particularly when looking for good growth stocks.
The PEG ratio also aids in evaluating the potential overvaluation or undervaluation of a stock in relation to its growth prospects. A PEG ratio below 1 is often interpreted as a stock being undervalued given its earnings growth, whereas a ratio above 1 might indicate overvaluation. This simple benchmark can guide investors in making more informed decisions.
What is the Formula to Calculate the PEG Ratio?
The PEG ratio includes two components: the stock’s P/E ratio and the annual EPS growth rate. This is what the formula looks like:

Creating a template in Excel to calculate the PEG Ratio
Calculating the PEG ratio in Excel is straightforward, allowing investors to efficiently assess multiple stocks’ growth prospects against their valuations. Here’s a step-by-step guide to setup a worksheet to help you do this:
- Input Data: Begin by entering the necessary data into Excel. You’ll need the current stock price, EPS, and the annual EPS growth rate. Ideally, you’ll want to setup the inputs first, followed by the formulas at the bottom. This will make it easier to enter the data in logical steps: first the ticker, the stock price, the EPS, and then the annual EPS growth.
- You can get the stock price into excel using the STOCKHISTORY function.
- You can get the EPS from most financial websites. If you’re doing this on Google Sheets, you can directly pull the P/E value as well as the stock price using the GOOGLEFINANCE function.
- For the annual EPS growth rate, you can pull this from a site such as Yahoo Finance (it’s under the ‘Analysis’ section). The percentage used is based on the next 5 years. Although it is percentage, enter it as a number (i.e. 100% would be 100).
- Calculate P/E Ratio: In the first calculation cell, I’ll calculate the P/E ratio by dividing the stock price by the EPS.
- Calculate PEG Ratio: The next calculation cell is the PEG ratio. This is calculated by taking the P/E ratio and dividing it by the annual EPS growth rate. If a stock is expected to grow at a 50% growth rate, the value should be 50, not 0.5 (i.e. don’t enter it as a percentage). Otherwise, this won’t calculate correctly.
- Conditional Formatting. This is an optional step, but one which can help with your analysis. Use conditional formatting rules to highlight the PEG ratio based on its value. If it is less than 1, I’ll apply a green highlighting, a red highlight if it is more than 3, and yellow for anything in-between. Here is how you might set that up with an icon set

Here is how the template looks based on their stock prices and data as of Feb. 1, 2024:
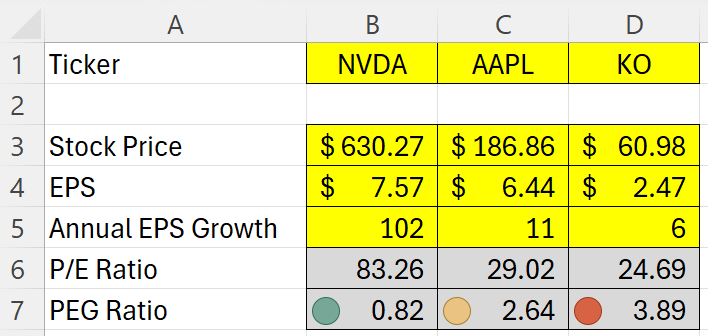
In the above example, we have a fast-growing stock in NVDA, a moderate-growing stock in AAPL, and a slower-growing one in KO. Essentially what we are doing here is looking if the EPS growth rate is higher than the P/E ratio. If it is, that suggests it is not an expensive buy. NVDA, for example, is expected to more than double each year for the next five years, as is evident by its 102% EPS growth rate. While that would make it look like a cheap buy, you’re also assuming that it really can achieve that kind of a growth rate, which would be no easy feat. That leads us to an important part section: the limitations of this calculation.
Limitations of the PEG Ratio
While the PEG ratio offers valuable insights into a stock’s potential value by incorporating growth into the valuation equation, it’s important to recognize its limitations. Understanding these constraints can help investors use the PEG ratio more effectively alongside other analysis tools.
- Growth Rate Estimations: The PEG ratio is heavily dependent on the accuracy of the earnings growth rate projections. These forecasts can be highly speculative and vary widely among analysts. Overly optimistic or pessimistic growth estimates can skew the PEG ratio, leading to potentially misleading conclusions about a stock’s valuation.
- Historical Growth vs. Future Potential: The PEG ratio typically uses historical data to predict future growth, but past performance is not always a reliable indicator of future results. Companies in rapidly changing industries or facing new competitors may not sustain their previous growth rates.
- One-Size-Fits-All Approach: The simplicity of the PEG ratio, while a strength, can also be a drawback. It does not account for the nuances of different industries or the specific risks and opportunities facing individual companies. A low PEG ratio does not guarantee success, nor does a high PEG ratio always indicate a bad investment.
- Dividend Exclusion: The PEG ratio does not consider dividend payments. For income-focused investors, a company’s dividend yield and the stability of its dividend payments can be as important as growth. Companies with high dividend yields might be undervalued by the PEG ratio, which only focuses on earnings growth.
- Market Conditions: The effectiveness of the PEG ratio can also be influenced by the overall market conditions. During bull markets, growth stocks tend to perform well, and their high PEG ratios may be justified by the market’s momentum. Conversely, in bear markets, value stocks with lower PEG ratios might be more favorable, regardless of growth projections.
- Quantitative Focus: The PEG ratio is a purely quantitative tool and does not take qualitative factors into account. Elements such as management quality, brand strength, market position, and industry trends can significantly impact a company’s future performance but are not reflected in the PEG ratio.
If you liked this post on How to Calculate the PEG Ratio in Excel, please give this site a like on Facebook and also be sure to check out some of the many templates that we have available for download. You can also follow us on Twitter and YouTube.