

What is the TRIMMEAN function?
The TRIMMEAN function has been available on Excel since the 2016 version. What it does is return the mean (average) of your data set, but it excludes a portion of your data. This can be useful if you want to exclude outliers and data that may not be typical. Small and large numbers can sometimes skew a data set and while you could use the MEDIAN function to get the middle value, you may also prefer to just exclude the highest and lowest values.
It offers another way to calculate an average, which may be more representative than the MEDIAN. What you may want to consider is using the function alongside the MEDIAN and AVERAGE functions, to see just how much of a disparity there is in your data set.
How the TRIMMEAN function works
The TRIMMEAN function has just two required arguments: array and percent. The first argument is the array of numbers you want to calculate for the average. The second argument is where you specify the percentage of outliers you want to exclude. If you have 10 data points and enter 0.2 for 20%, that would eliminate 2 data points — 1 from the top and 1 from the bottom.
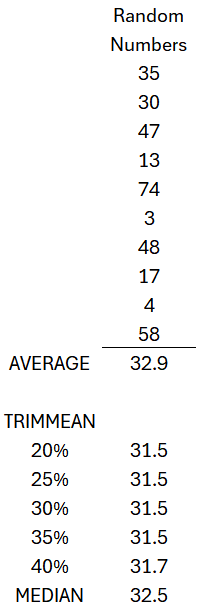
In the below example, I have a list of 10 random numbers between 1 and 100:
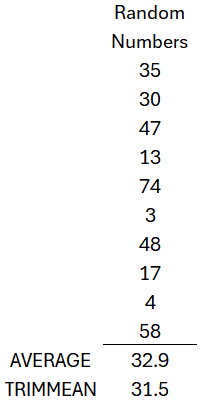
Using the AVERAGE function, it calculates a value of 32.9 as the average. But if I apply the TRIMMEAN function as specified above, where I exclude 20% of the values, then the value I get is 31.5. Here’s how that is calculated:
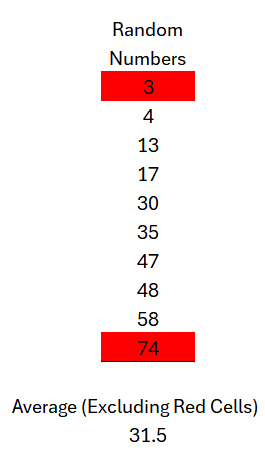
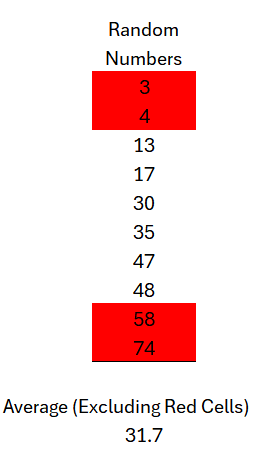
If you sort the data and exclude the largest and smallest number, the rest will average out to 31.5. If I were to change my percentage argument to 0.4 and 4 numbers are excluded, the top 2 and bottom 2 numbers will be excluded:
But what if the percentage you specify doesn’t result in an even number to remove from the top and bottom? For example, what if you want to exclude 30% of the numbers from a list of 10 values? In that case, the TRIMMEAN function still excludes just 2 numbers. Until it can remove an even number from both the top and the bottom, it won’t exclude any further numbers. Here’s how it calculates as you increase the percentage:
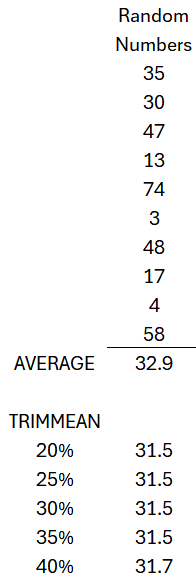
As you can see, the TRIMMEAN function doesn’t return a different amount until it gets to 40%, at which point it can remove an even numbers from the top and bottom of the range (2).
This is an important thing to keep in mind when using the function as it can result in an incorrect assumption that you are ignoring a certain percentage of numbers when really, it won’t be excluding that many unless you enter a high enough percentage where it can trim an equal number from the top and bottom of the range.
How does this compare against the MEDIAN calculation?
The big question is whether this TRIMMEAN function is still useful given the noted limitations. Here’s how it calculates versus the MEDIAN function, which simply takes the middle number (or averages the two middle values):
In this example, the TRIMMEAN function returns a lower value. However, if the values 47 and 48 and changed to 37 and 38, then the result would be as follows:
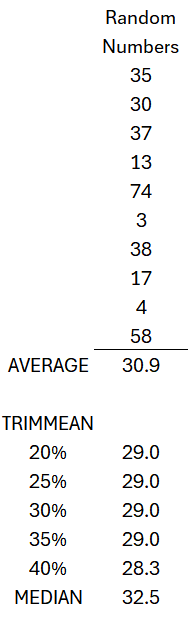
The MEDIAN function is the only one which returns the same value, since it is averaging the middle two values (30 and 35). However, both the AVERAGE and TRIMMEAN functions return lower values.
There is no right or wrong function to use but using all three can help you gain some insights into your data and how much variance there is in it.
If you liked this post on How to Use the TRIMMEAN Function in Excel, please give this site a like on Facebook and also be sure to check out some of the many templates that we have available for download. You can also follow me on Twitter and YouTube. Also, please consider buying me a coffee if you find my website helpful and would like to support it.