
A Pareto chart is a useful tool for identifying the most significant factors in a dataset. It’s based on the Pareto principle—also known as the 80/20 rule—which suggests that roughly 80% of outcomes come from 20% of causes. While that may not always be the case, the chart can help you focus your efforts on the most important items in your data.
Start with preparing your data
To begin, you’ll need a dataset with categories and their frequency or values. In the table below, there are various customer issues, and the frequency of them.

You should aim to sort the data in descending order for frequency, as that will make it easier to read and interpet the chart.
Insert the Pareto chart from the Histogram section
With your data prepared, you can now go ahead and create the chart. Start by selecting one of the values from your data and go to the Insert tab. Click on the small arrow to open up all the available charts to choose from. Then, under the All Charts tab, navigate to Histogram section and select Pareto, which shows column charts and a red line going across.

This now produces the following chart:

The red line chart represents the cumulative count of all the frequency items, starting from left to right. This is the advantage of sorting the data beforehand, as it makes it easier to identify the major issues. From this chart, we can see that the five largest issues (shipping errors, damaged items, wrong product, late delivery, and missing parts) account for 80% of the total issues. This analysis can help focus your efforts on the issues which come up the most often.
Create a Pareto chart to track sales
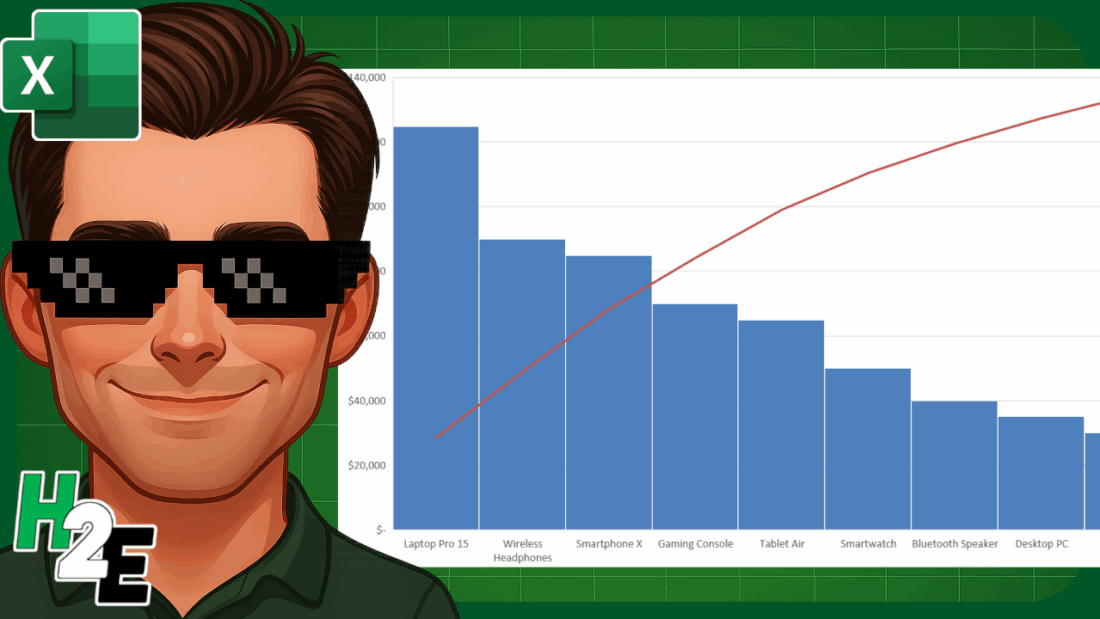
We can do a similar analysis when looking at sales. In the following table, we have a list of highest-selling products, also sorted in descending order.

By creating a Pareto chart from this, data, we can see the following trend:

This chart shows similar information, but rather than frequency, it displays cumulative sales, telling that roughly 60% of sales come from four items.
If you liked this post on How to Make a Pareto Chart in Excel, please give this site a like on Facebook and also be sure to check out some of the many templates that we have available for download. You can also follow me on Twitter and YouTube. Also, please consider buying me a coffee if you find my website helpful and would like to support it.