
Want an easy way to track your expenses? In this post, I’ll show you how you can use my free expense tracking template, which is based in Google Sheets. It makes copying and pasting expenses over simple, and you can quickly see reports that summarize your spending. No need for macros or even refreshing data.
How the expense tracker template works
There are just two tabs in the expense tracker template. One is Data tab where you enter all your expenses, and one is the Summary tab that has charts where no data entry is required.
Entering the data
On the Data tab, these are the following areas where you’ll enter in information:
- Columns A & B are for the Vendor and Amount. Expenses should be positive and refunds are negative. This can just by copy and pasted from your bank or credit card statement downloads.
- Column C is optional and only necessary if you don’t want an expense item to go to its default category. For example, you may have a one-time expense that throws off your budget for a spending category. You can check off the box for ‘Irregular’ and it will flow through to that category and bypass the default spending category.

- Columns G and H are where you will set up your Vendors and which spending category they relate to. This is important so that when you enter your transaction data in columns A & B, the Category field (Column E) will automatically populate as well. Otherwise, everything will go into a “Not Categorized” bucket.

- Column J (aside from the first row which is reserved for income) is where you will set up your spending categories. The spreadsheet accommodates 10 categories. Any more than that and the charts can become difficult to read.
- In Cell K1 you can enter an income amount (if applicable). The other values in column K are simply a tally of the spending by category.
Once you have all your transactions entered, you can go to the Summary tab where you’ll see a summary of your spending.
The reports
There are three charts on the Summary tab:
- A waterfall chart is the main chart that you’ll see on the page. It shows you your spending during the period. This starts with an income amount (this is entered on the Data tab) and every expense is negative afterwards, showing you how much of your income is left over. There are two totals, one before irregular expenses and one that includes everything. The purpose here is to show how your spending would have looked if not for one-time, irregular expenses, and how much of your income was left before and after those expenditures.

- There is an Amount vs Vendor chart which shows you spending by Vendor.

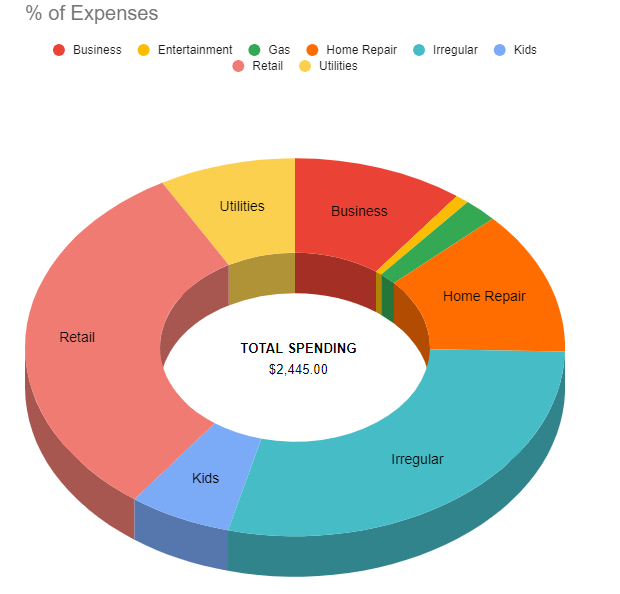
- % of Expenses shows a breakdown of spending by the different categories. In the middle it shows the total spending during the period.
There is no defined period for this template
There are no date fields in this template for the purpose of keeping it simple. Whether you want to look at one week, two weeks, a month, or several months, you can plug the data into here to see how much your spending was for that period. However, if you get past row 200, you will want to copy down the checkboxes and the formula in column E.
Download and use the template
The reports in the template don’t require a refresh and so as soon as you enter your data, you can begin viewing the Summary tab.
If you’d like to use the template, you can get a copy of it here.
If you like this Expense Tracking Template, please give this site a like on Facebook and also be sure to check out some of the many templates that we have available for download. You can also follow us on Twitter and YouTube.