

A column chart can be useful in data analysis to show growth, compare values, and display values by period. One of the drawbacks of a column chart is that as you add more data series and values to compare against, it starts to stretch out your chart. And when that happens, the data becomes more difficult to read. One way to conserve some space and to create a nice visual is by embedding one column chart within another. By doing this, you can show relative values. For example, one column chart might show total sales, while the embedded chart can show how much a particular product or geographical area accounted for.
Creating the column chart
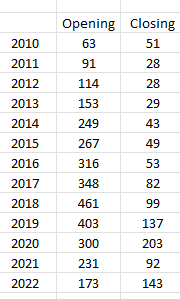
In this example, I’m going to use the data set from the following webpage, which shows brewpub openings and closings by year (https://www.brewersassociation.org/statistics-and-data/national-beer-stats/).
I’ve created a table of the data by year:
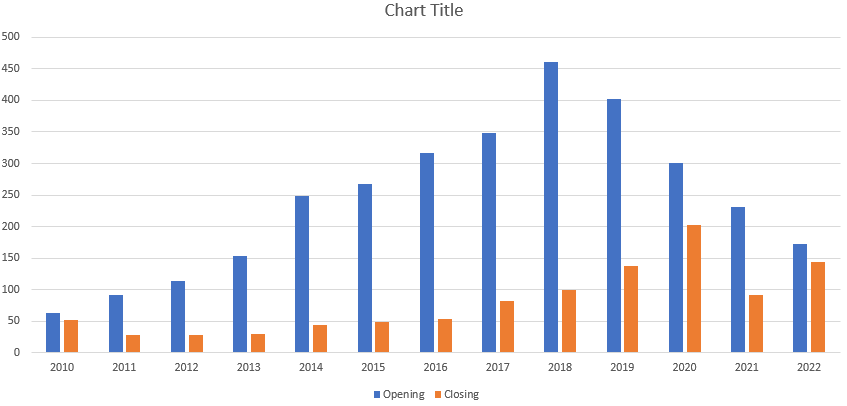
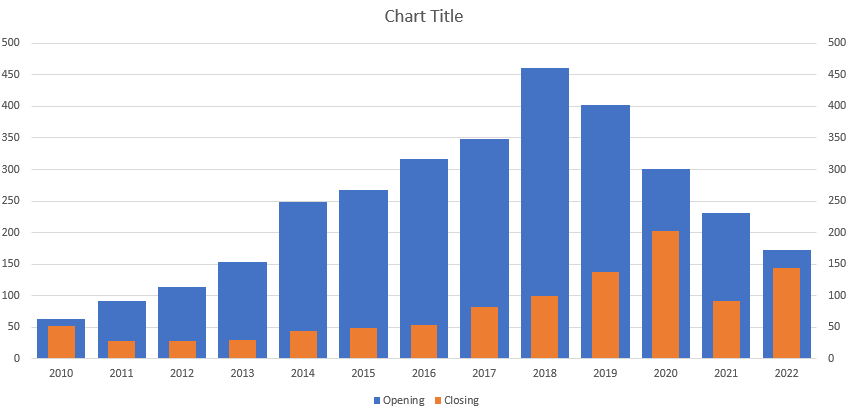
In this example, I’m going to use the openings as my outer column chart and the brewpub closing values as my inner column chart. This is because I know the closing values will be less than the opening values. When I first create the chart, I get both series showing up side by side:
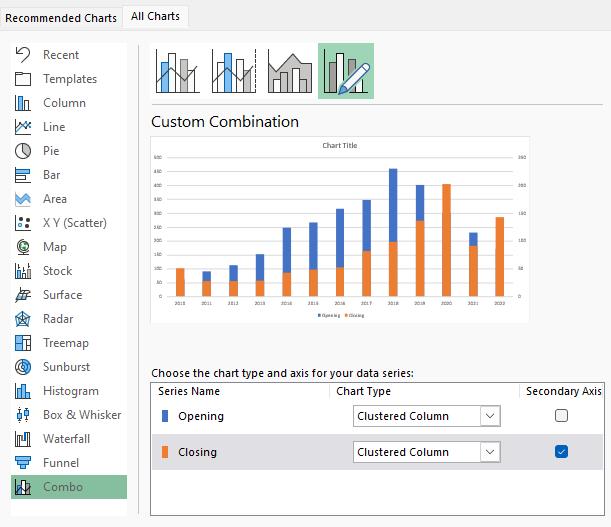
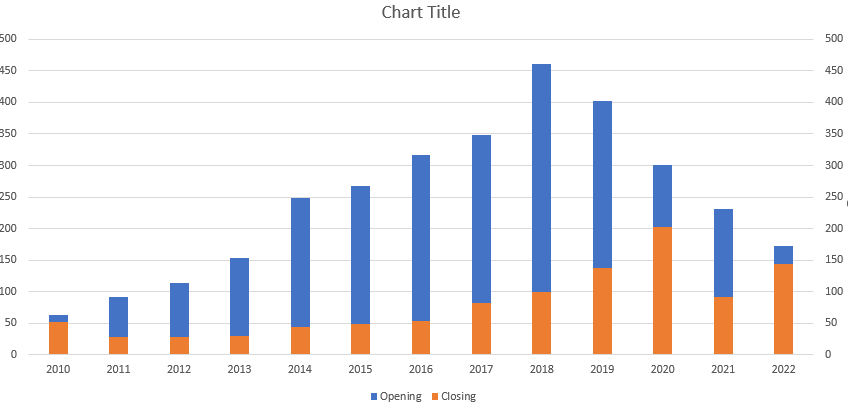
This is how you might normally look at these values when using column charts. But this time, I want the orange columns to be within the blue ones. Before I merge them together, I’m going to put the other chart on a secondary axis by right-clicking the chart and selecting Change Chart Type. At the bottom, I select Combo and make sure that they are both set to Clustered Column with the Closing series set to the Secondary Axis:
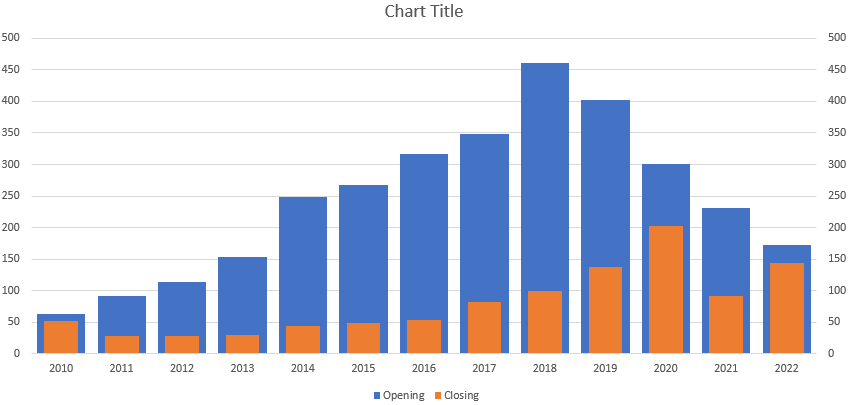
You can see that there is already a bit of an overlap in the charts. But the problem is that the axis have different ranges. To fix this, I’ll click on the secondary axis and select Format Axis. I will adjust it so the maximum value is set to the same as the maximum for the initial axis — 500. After doing that, my chart now looks like this:
This is already getting close what I wanted initially. However, I still want to have more of an embedded effect, for the closing series to be within the opening series. Now, if I right-click on the blue column chart and select Format Data, I’ll have an option to modify the Gap Width. What the gap width does is shrink the amount of white space between the columns. After setting it to 25, it looks like this:
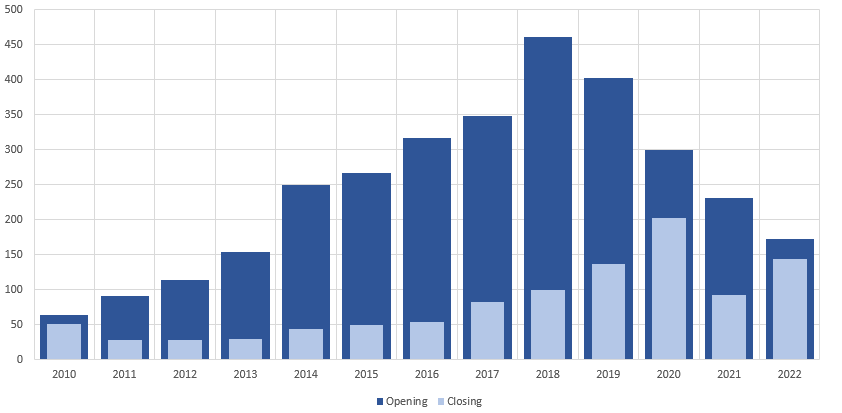
Next, I’ll set the orange columns to a gap width of 80:
The only thing left is possibly changing the color. To show that the two items are related, I prefer to use colors that are similar, with one being a darker shade than the other. I’ll also change the secondary axis font to white so that it is not visible, and add some vertical gridlines. That leaves me with this end result:
If you liked this post on How to Create a Column Chart Within Another Column Chart, please give this site a like on Facebook and also be sure to check out some of the many templates that we have available for download. You can also follow me on Twitter and YouTube. Also, please consider buying me a coffee if you find my website helpful and would like to support it.