

In the fast-paced world of investing, identifying trending stocks in Excel can provide a valuable edge for investors seeking profitable opportunities. Fortunately, with the power of Excel’s Power Query and the ability to connect to a website’s API, accessing real-time data and uncovering trending stocks has become more accessible than ever. In this article, I will go through the process of using Power Query to connect to a website’s API and importing in trending stock information.
Why should investors try to identify trending stocks?
As an investor, it is crucial to identify trending and popular stocks for several reasons:
- Profit Potential: Trending and popular stocks often have significant profit potential. When a stock is gaining popularity, it usually attracts more investors, leading to increased demand and potentially driving up the stock price. By identifying these stocks early, you can position yourself to benefit from the price appreciation and generate higher returns on your investment.
- Liquidity: Popular stocks tend to have higher liquidity, meaning there is a larger pool of buyers and sellers in the market. This liquidity allows you to enter and exit positions more easily, ensuring that you can buy or sell shares without significantly impacting the stock’s price. Investing in liquid stocks provides flexibility and reduces the risk of being unable to execute trades at desired prices.
- Market Validation: The popularity of a stock often reflects positive market sentiment and investor confidence. When a company is trending and gaining attention, it may indicate that the market believes in its growth prospects and overall performance. By identifying such stocks, you can align your investment choices with market sentiment and increase the likelihood of investing in companies with strong fundamentals and future growth potential.
- Information Availability: Popular stocks generally attract more media coverage, research reports, and analyst attention. This increased coverage provides you with a wealth of information and analysis to make more informed investment decisions. You can leverage these resources to understand the company’s financial health, competitive position, industry trends, and other relevant factors that can impact the stock’s performance.
How to get trending stocks in Excel
To get trending stock data into Excel, you should start with finding a good source that you can rely on for trending data. For this example, I’m going to use apewidsom.io, which provides free access to its API using the following url: https://apewisdom.io/api/. Here’s how I’m going to use that to pull in trending data:
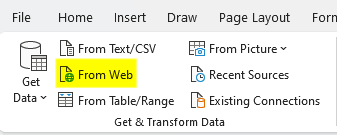
Extract the data using Power Query. To get started, I’ll select the Data tab in Excel and click on the From Web option.
Next, there will be a field to enter the URL, this is where I will paste the link that the API references:
https://apewisdom.io/api/v1.0/filter/all-stocks/page/4

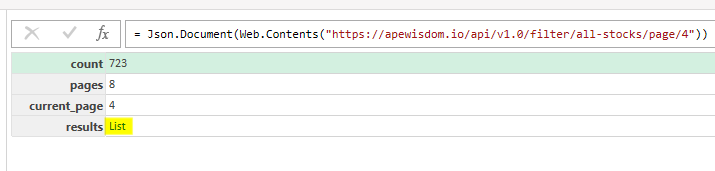
After clicking OK, Power Query will launch. When the screen opens up, the following table appears. I click on List to open up another table.
After clicking that, there’s another list of records.
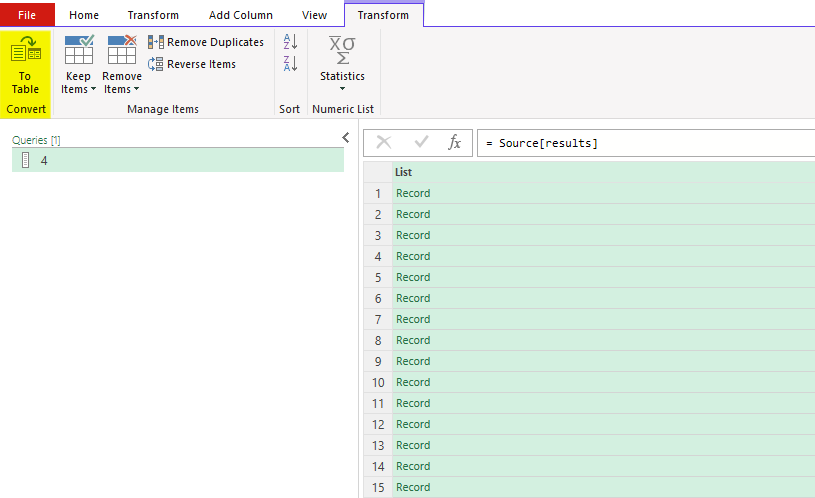
Here, I’ll select the option to convert to table and leave the default settings and click OK. Then, there is another list of records. Clicking on the button with the arrows going in opposite directions will expand them:
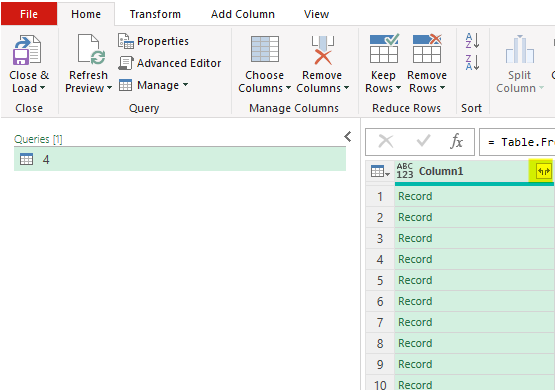
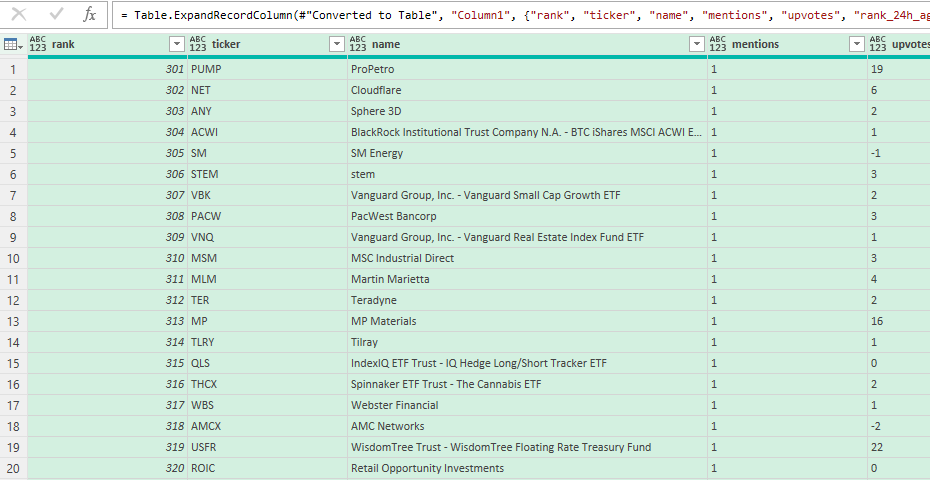
After expanding out those records, the table will now looks like a list of stocks and metrics relating to mentions, upvotes, and overall rank popularity:
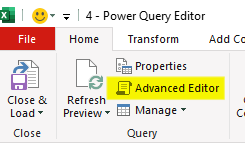
Now that this has been setup, I will convert this into a Power Query function. To do that, I’ll click on the Advanced Editor button:
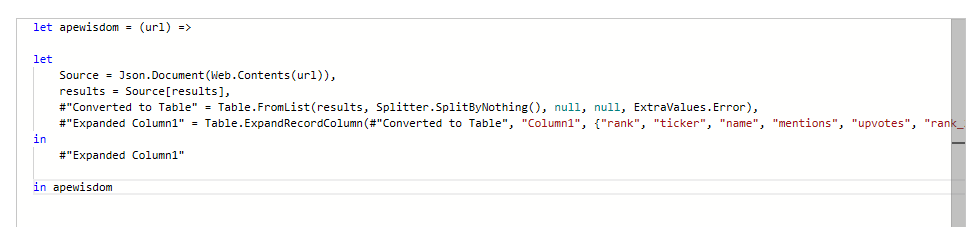
In the editor, I will add a line at the top to specify the name of the function. And at the bottom, I will add a line to circle back to it. Lastly, I’ll add a variable for the URL as well, and put that where the link used to be:
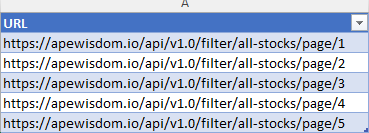
Next, with the custom function created, I’m going to go back into Excel and create a list of all the URLs I want to use this function on. In this situation, I’m going to adjust the page number at the end of the URL so that I have pages 1 through 5:
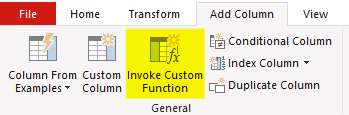
I’ll load this table, called URLtable, into Power Query using the From Table/Range button when selecting data. Next, I’ll select the Add Column tab and select Invoke Custom Function:
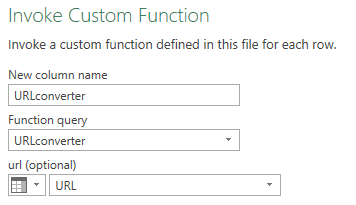
Then, I reference the query as well as the URL variable that is to be used:
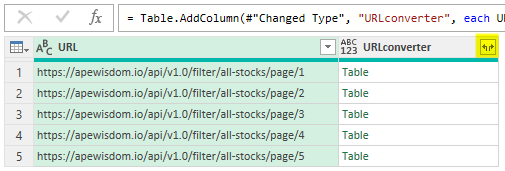
Then, there will be a field with the results, in table format. Again, this needs to be expanded out:
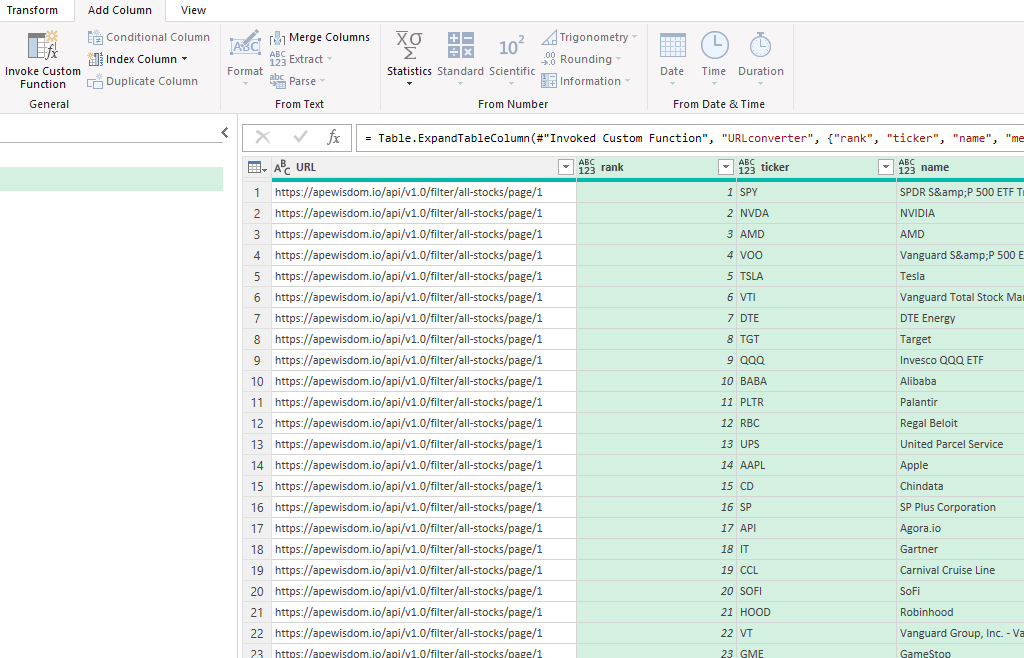
That will leave a list of stocks starting from page 1 all the way through page 5. You can remove the URL field, which is no longer needed:
If you don’t want to follow through all those steps yourself, you can download the template I’ve created here.
If you liked this post on Get Trending Stocks Into Excel Using Power Query, please give this site a like on Facebook and also be sure to check out some of the many templates that we have available for download. You can also follow me on Twitter and YouTube. Also, please consider buying me a coffee if you find my website helpful and would like to support it.