

What is RSI?
The Relative Strength Index (RSI) is a popular trading indcator that investors use for trading purposes. In this article, I’ll go over details as to what RSI is, why it’s useful, and how to calculate it in Excel.
RSI is a bounded oscillator that fluctuates between 0 and 100, providing insights to investors as to whether a stock is overbought or oversold. It compares the magnitude of recent price gains relative to recent price losses over a specified period of time, typically 14 days, and generates a value that indicates the potential for a price reversal or continuation.
The higher the losses are relative to the gains, the lower the RSI value becomes. And the opposite is also true, with the RSI value rising when a stock has been accumulating more gains than losses. Generally, an RSI value above 70 indicates an overbought condition, suggesting a potential price correction or reversal to the downside. Conversely, an RSI value below 30 indicates an oversold condition, implying a potential price bounce or reversal to the upside. Traders often use these overbought and oversold levels to identify possible entry or exit points in the market.
Why RSI Is a Useful Indicator for Traders
It’s important to note that the RSI is just one tool among many in technical analysis, and it should be used in conjunction with other indicators and analysis methods to make well-informed trading decisions. However, here are 4 reasons traders might find it useful:
1. Finding overbought and oversold levels
RSI can help investors identify buying and selling opportunities. When a stock is deeply oversold and the business is still in good shape but perhaps is down due to a bad quarter, it could be a sign to buy the beaten-down stock. In essence, it can help find market overreactions. At the same time, it can spot a stock that perhaps has become too hot when its RSI level is over 70 or 80, and that perhaps it has risen too much and too quickly.
It’s useful to also look at a stock’s historical RSI levels to gauge what kind of an opportunity it is. If it frequently dips in and out of oversold/overbought territory, it could simply be that the stock is volatile. But if it is rare for the stock to become oversold/overbought, then it could make for a good opportunity to buy or sell the stock depending on what the indicator says.
2. Measuring momentum and confirming a trend
The RSI provides insights into the strength and momentum of a price trend. When the RSI is rising and stays above 50, it indicates that buying pressure is dominant and the price trend may continue. Conversely, when the RSI is falling and stays below 50, it suggests that selling pressure is dominant and the price trend may continue downward. This information can help investors confirm the strength of a trend and make informed decisions about entering or exiting positions.
3. Identifying divergence patterns
Another valuable aspect of the RSI is its ability to identify divergence patterns. Divergence occurs when the direction of the RSI differs from the direction of the price. Bullish divergence happens when the price makes lower lows while the RSI makes higher lows, indicating a potential trend reversal to the upside. On the other hand, bearish divergence occurs when the price makes higher highs while the RSI makes lower highs, suggesting a potential trend reversal to the downside. Investors can use these divergence patterns as early warning signals of potential trend shifts and adjust their investment strategies accordingly.
4. Confirmation with other indicators
The RSI can be used in conjunction with other technical indicators to confirm signals and strengthen investment decisions. For example, if a stock shows overbought conditions based on the RSI, investors may look for additional indicators such as bearish candlestick patterns or negative volume divergences to support their decision to sell or take profits.
Other technical indicators investors can use alongside RSI
Investors often use many different indicators to make investment decisions. Here are a few commonly used indicators that can be used in conjunction with the RSI:
1. Moving Averages
Moving averages are trend-following indicators that smooth out price fluctuations over a specific period. The most commonly used moving averages are the simple moving average (SMA) and the exponential moving average (EMA). Investors often use moving averages in combination with the RSI to identify trend direction and potential support or resistance levels.
2. MACD (Moving Average Convergence Divergence)
The MACD is another trend-following momentum indicator that consists of two lines, the MACD line and the signal line. It helps identify potential buy and sell signals by measuring the relationship between two moving averages. Traders often look for convergence or divergence between the MACD and the RSI to confirm potential trend reversals or continuations.
3. Bollinger Bands
Bollinger Bands consist of a centerline (typically a moving average) and two bands that are plotted above and below it. These bands represent volatility levels. When the price reaches the upper band, it suggests that the asset is overbought, while reaching the lower band suggests oversold conditions. Combining Bollinger Bands with the RSI can provide additional insights into potential price reversals or breakouts.
4. Stochastic Oscillator
The Stochastic Oscillator is a momentum indicator that compares the closing price of an asset to its price range over a specific period. It consists of two lines, %K and %D, which oscillate between 0 and 100. Traders often look for oversold or overbought conditions on the Stochastic Oscillator in conjunction with the RSI to confirm potential trading signals.
5. Volume indicators
Volume indicators, such as On-Balance Volume (OBV) or Volume Weighted Average Price (VWAP), provide insights into the buying and selling pressure behind price movements. By analyzing volume alongside the RSI, investors can assess the strength and validity of potential price trends or reversals.
6. Fibonacci retracements
Fibonacci retracements are based on the mathematical relationships found in the Fibonacci sequence. They are used to identify potential support and resistance levels. Combining Fibonacci retracements with the RSI can help investors identify areas where a price correction or reversal may occur.
These are just a few examples of indicators that investors can use alongside the RSI. The choice of indicators depends on the investor’s trading strategy, timeframes, and personal preferences. It’s important to test and evaluate different combinations of indicators to find a system that works well for individual investment goals and risk tolerance.
Why you shouldn’t buy a stock just because the RSI is low
Buying a stock solely based on a low RSI level is not a recommended approach for several reasons:
1. It lacks context
The RSI is just one indicator and provides a snapshot of the stock’s recent price performance relative to its own historical price movements. It doesn’t take into account other fundamental factors or external market conditions that may impact the stock’s future prospects. For example, a stock may have a very low RSI because investors are selling it off due to liquidity issues or problems that may significantly impact the investing thesis behind a stock. Therefore, solely relying on the RSI without considering other relevant information may lead to an incomplete assessment of the stock’s potential.
2. False signals
The RSI is a bounded oscillator that fluctuates between 0 and 100. While an RSI below 30 may indicate an oversold condition, it doesn’t guarantee an immediate rebound or a profitable buying opportunity. Stocks can remain oversold for extended periods, and the RSI alone may not accurately predict the timing or magnitude of a price reversal. It’s essential to consider other technical and fundamental indicators to validate the potential opportunity.
3. Downtrends and value traps
A low RSI reading can sometimes be an indication of a stock in a prolonged downtrend. Just because a stock is oversold does not mean it will necessarily recover or provide substantial returns. There may be fundamental reasons behind the stock’s decline, such as poor financial performance, unfavorable industry conditions, or negative news. Investing solely based on a low RSI without understanding the underlying reasons for the low reading can lead to falling into a “value trap” not unlike how investors may buy a stock simply because its price-to-earnings multiple is low.
4. Confirmation bias
Relying solely on the RSI to make investment decisions may lead to confirmation bias, where investors seek information that supports their preconceived notions. It’s crucial to consider a broader range of indicators, conduct thorough research, and evaluate multiple factors to make well-informed investment decisions.
5. False oversold signals in strong downtrends
In strong downtrends, a stock can remain oversold for an extended period as selling pressure continues. Attempting to catch a falling knife solely based on a low RSI reading can result in further losses if the stock continues its downward trajectory. It’s important to assess the overall trend, market conditions, and other technical and fundamental factors to increase the probability of making successful investment decisions.
While the RSI can be a useful tool to identify potential opportunities, it should be considered as part of a comprehensive analysis that incorporates other indicators, fundamental analysis, and market conditions. By taking a holistic approach to investment decision-making, investors can make more well-rounded and informed choices.
How do you calculate RSI?
Here are the steps to take when determining how to calculate RSI:
1. Determine the timeframe
Traders usually use a 14-day timeframe for calculating the RSI, but it can be adjusted to suit different trading strategies and timeframes.
2. Calculate the average gain and average loss
The RSI compares the average gains and average losses over the chosen timeframe. To calculate the average gain, sum up all the positive price changes (gains) over the period and divide them by the number of periods. Similarly, calculate the average loss by summing up all the negative price changes (losses) and divide that by the number of periods.
3. Calculate the relative strength (RS)
The relative strength is the ratio of the average gain to the average loss. RS = Average Gain / Average Loss.
4. Calculate the RSI
The RSI is derived from the relative strength and is calculated using the formula: RSI = 100 – (100 / (1 + RS)).
Calculating RSI in Excel
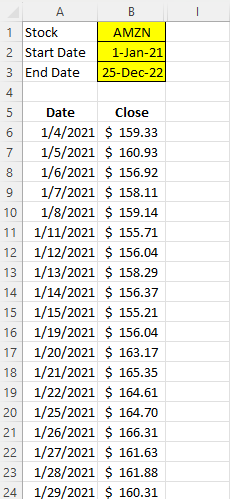
Using the STOCKHISTORY function in Excel, you can easily download a stock’s historical prices. In this example, I’ve downloaded Amazon’s stock price between the period Jan 1, 2021 and Dec 25, 2022.
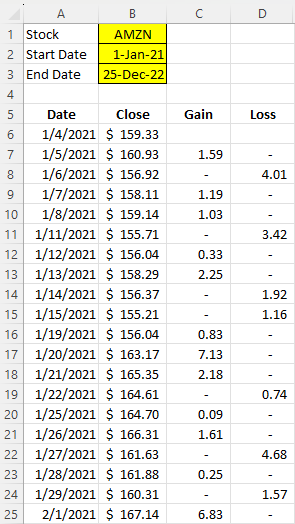
The next step is to calculate the gains and losses for each day. This just involves looking at the current closing price and the previous. If the price went down, the difference goes into the loss column. If it’s a gain, it goes into the gain column. Here’s an example of the formula for the gain column:
=IF(B7>B6,B7-B6,0)
Here’s a look at what the sheet looks like with the formulas filled in for the gain and loss columns:
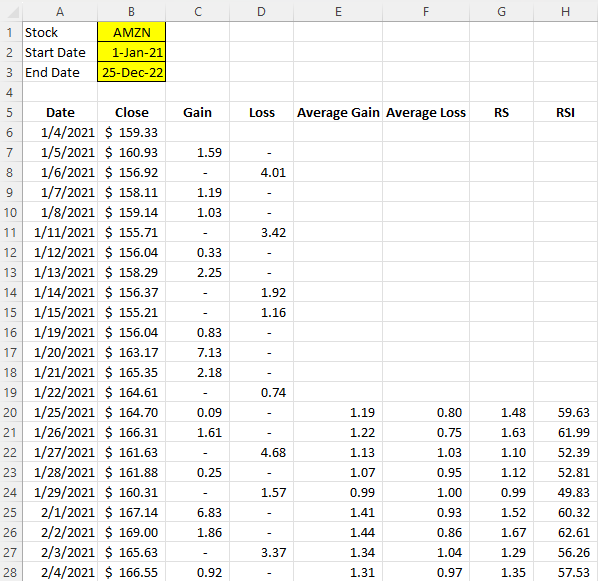
Next up, I need to calculate the average gains and average losses. I’ll do this for the past 14 trading days. For the first value, I just need to calculate a simple average:
=AVERAGE(C7:C20)
For subsequent cells, however, I’ll use an exponential average. That way, I’ll apply more weighting to the the most recent calculation:
=((E20*13)+C21)/14
Next, I will calculate the RS Value. To do this, I take the average gain and divide it by the average loss:
=E20/F20
Lastly, that leaves the RSI calculation, which contains the following formula:
=100-(100/(1+G20))
With all the fields filled in, this is what the spreadsheet looks like:
If you want to follow along with the file that I’ve created, you can download it from here. You can also watch the corresponding YouTube video that goes along with this tutorial:
If you liked this post on How to Calculate the Relative Strength Index (RSI) in Excel, please give this site a like on Facebook and also be sure to check out some of the many templates that we have available for download. You can also follow me on Twitter and YouTube. Also, please consider buying me a coffee if you find my website helpful and would like to support it.