

Inflation is a critical economic indicator, reflecting the rate at which the general level of prices for goods and services is rising, and subsequently, how that erodes the purchasing power of money. To gauge inflation accurately, economists and policymakers rely on various metrics, with the Consumer Price Index (CPI), the Personal Consumption Expenditures Price Index (PCE), and the Core PCE being the most prominent. Each of these measures has its unique methodology and scope, making them useful in different economic contexts.
Let’s start with breaking down how these different measures are calculated, and what their strengths and weaknesses are.
Consumer Price Index (CPI)
The CPI, published by the Bureau of Labor Statistics, is one of the most widely recognized measures of inflation. It calculates the average change over time in the prices paid by urban consumers for a basket of goods and services. This basket includes a wide range of items such as food, clothing, shelter, fuels, transportation fares, charges for doctors and dentists’ services, drugs, and the other goods and services that people buy for day-to-day living. Prices are collected monthly from about 75 urban areas across the country, from about 6,000 housing units and approximately 22,000 retail establishments.
The strength of the CPI lies in its detailed breakdown of expenditure categories, which makes it a useful tool for understanding the impact of inflation on consumers. However, it has its limitations. For instance, it does not account for changes in consumer behavior or substitutions they make in response to price changes. Also, the CPI focuses only on urban consumers and may not accurately represent the experience of people in rural areas.
Personal Consumption Expenditures Price Index (PCE)
The PCE, published by the Bureau of Economic Analysis, measures the prices that people living in the United States, or those buying on their behalf, pay for goods and services. Unlike the CPI, the PCE includes all goods and services consumed by households, including those paid for by third parties such as employer-provided healthcare. The PCE is calculated by using data on nearly all goods and services businesses sell to households and on the incomes that households receive from business and from government.
One key advantage of the PCE is its ability to reflect changes in consumer behavior and the substitutions they make, which the CPI does not fully capture. This makes the PCE a broader measure of inflation. However, its wide scope can sometimes dilute the impact of price changes in specific categories, which might be more apparent in the CPI.
Core PCE
The Core PCE Price Index is a version of the PCE index that excludes the more volatile and seasonal food and energy prices. By excluding these items, Core PCE provides a clearer picture of the underlying inflation trend and is less subject to short-term volatility. This makes Core PCE a preferred metric for policymakers, including the Federal Reserve, when making decisions about monetary policy. This metric is often referred to as ‘core inflation.’
The exclusion of food and energy prices can be both a strength and a weakness. While it offers a more stable view of inflation, it can sometimes underrepresent the actual burden on consumers, especially during periods when food and energy prices are rapidly changing.
Calculating CPI, PCE, and Core PCE
Now that we know what these metrics are, let’s grab that data and plot them in a chart, to see how they have been trending in recent periods.
CPI can be downloaded from www.bls.go/cpi. The link to get the historical data can be found at https://data.bls.gov/timeseries/CUUR0000SA0?years_option=all_years. You can follow along with this post on how to calculate the inflation rate based on this data set with Power Query.
PCE and Core PCE can be downloaded from the stlouisfed website. Below are the follow links you can use to access the data for each of them: https://fred.stlouisfed.org/series/PCEPI and https://fred.stlouisfed.org/series/PCEPILFE. This data can easily be downloaded from the Fred website and compared both metrics.
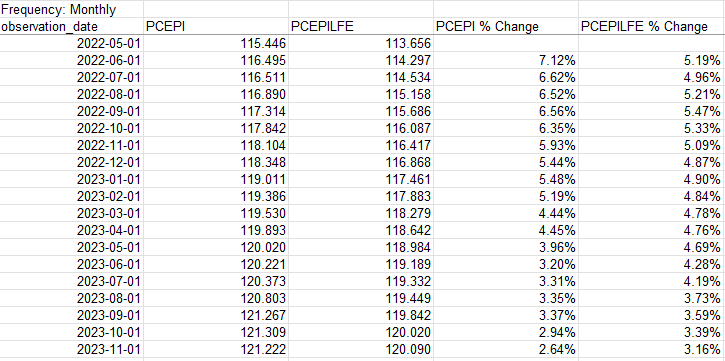
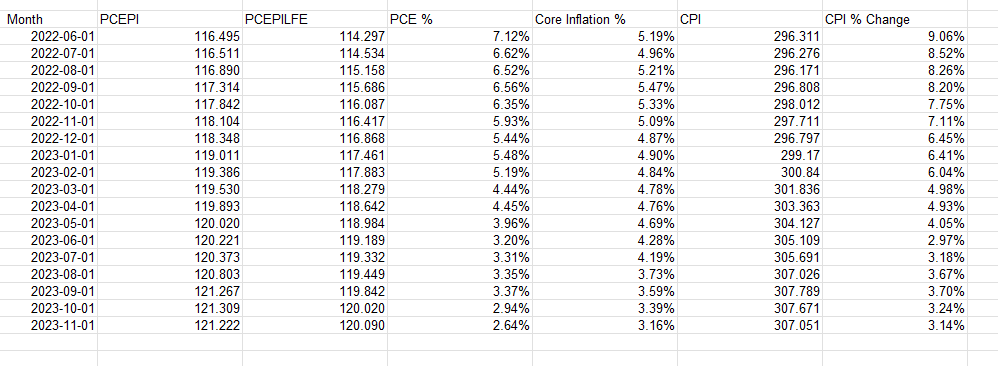
For the % change, take the current month value and divide it by the same value in the prior-year month and deduct 1. Here’s how all the data points and inflation rates look when compared against one another:
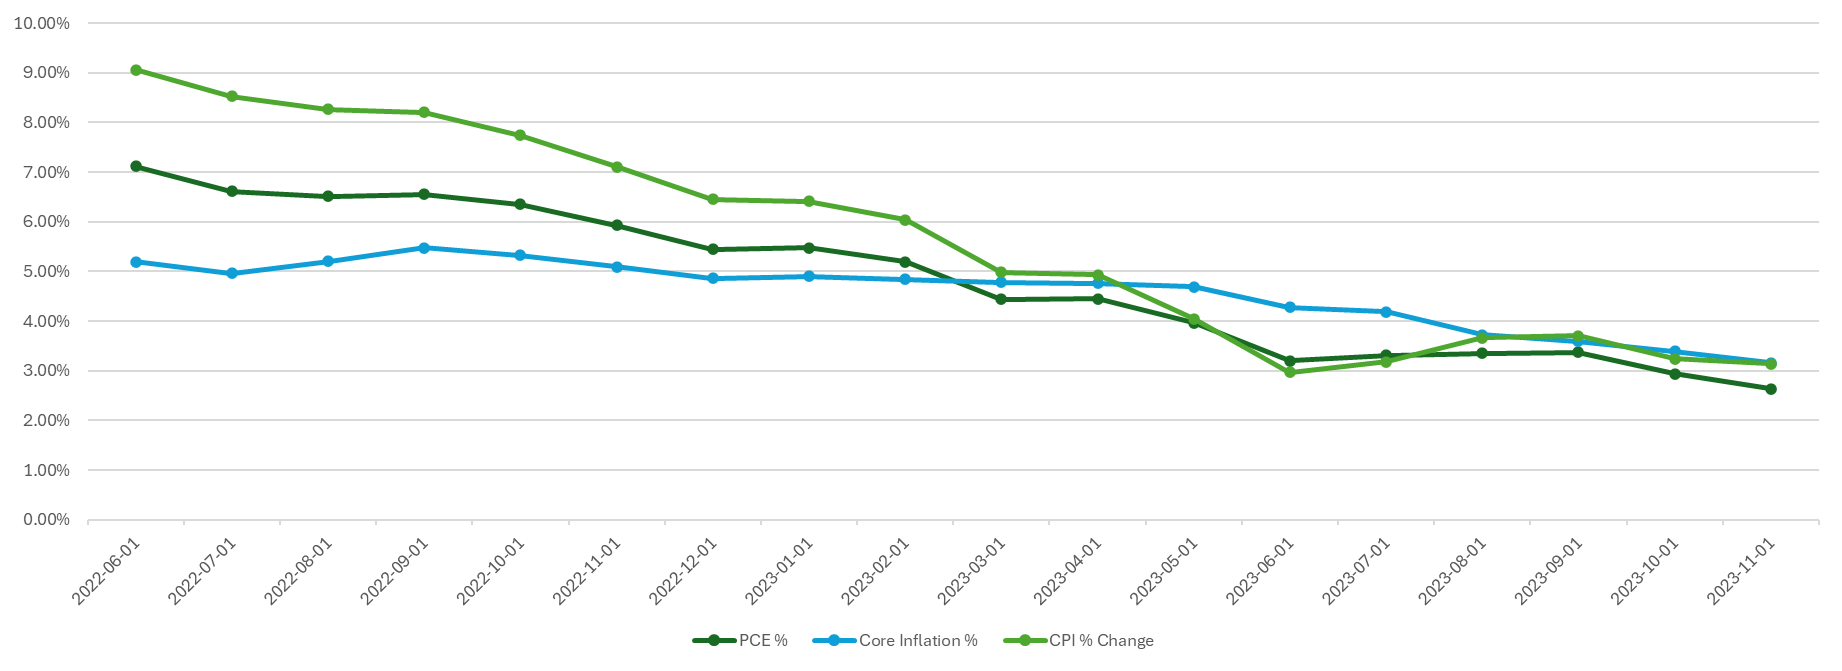
With that data set up, it’s now easy to plot the different inflation rates on a chart to see how they have varied and converged over the past year and a half:
If you liked this post on How to Calculate Inflation, Core Inflation, and CPI in Excel, please give this site a like on Facebook and also be sure to check out some of the many templates that we have available for download. You can also follow us on Twitter and YouTube.