
Moving averages can be useful in data analysis, when looking at trends both in finance and in the stock market. You can look at 30, 60, 90 day trends, and even longer or shorter durations. There’s also a difference between whether you are looking at a simple moving average and an exponential moving average. In this article, I’ll go over the differences between the two, and show you how you can calculate them in Excel.
How to Calculate a Moving Average (MA) in Excel
A moving average is a simple tool used by investors and traders to smooth out price data over a specified period. It is called “moving” because it is continually recalculated based on the latest data, providing a dynamic view of an asset’s average price over time. The advantage of an MA is its simplicity as it can easily be calculated.
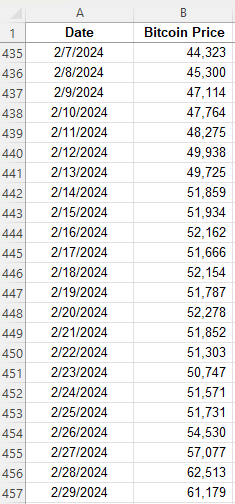
A moving average is calculated by simply taking the average of the trailing periods. In the case of a 60-day MA, you would look at the average over the past 60 days. If it’s a 90-day MA, then you average the past 90 days. In the following example, I have the price of Bitcoin over the past few years. Ideally, when setting up moving averages, you want your dates in ascending order, going from oldest to newest.
Here are the steps to calculate the moving average:
- Determine the number of periods you want to go back. For 5 days, it will be 5, for 10 days it will be 10, and so on.
- Calculate the average in the adjacent column. Make sure you do not freeze cells.
- Copy the formula down so that the average moves (hence why you do not want to freeze cells).
Here is what the values look like, along with the formula for each cell:
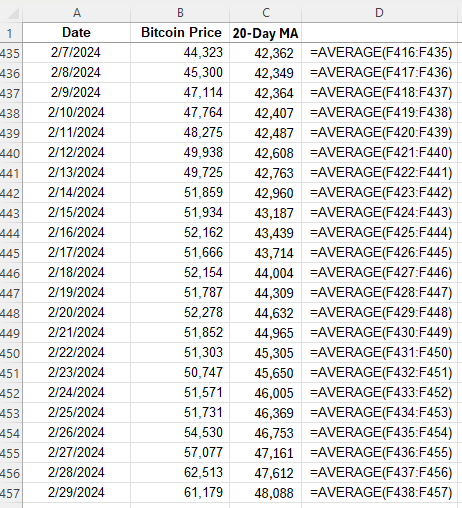
The average is continuously moving with each cell, but it always contains a range of 20 values since the 20-day MA contains 20 days. Oftentimes, people using multiple moving averages as a way to identify crossovers, such as when stocks cross 20-day MAs and 50-day MAs. Depending on the direction of the crossover, it can be a very bullish indicator (20-day MA crosses from underneath) or a very bearish indicator (20-day MA crosses from above). This is what those moving averages look like for Bitcoin and how they appear on a chart:
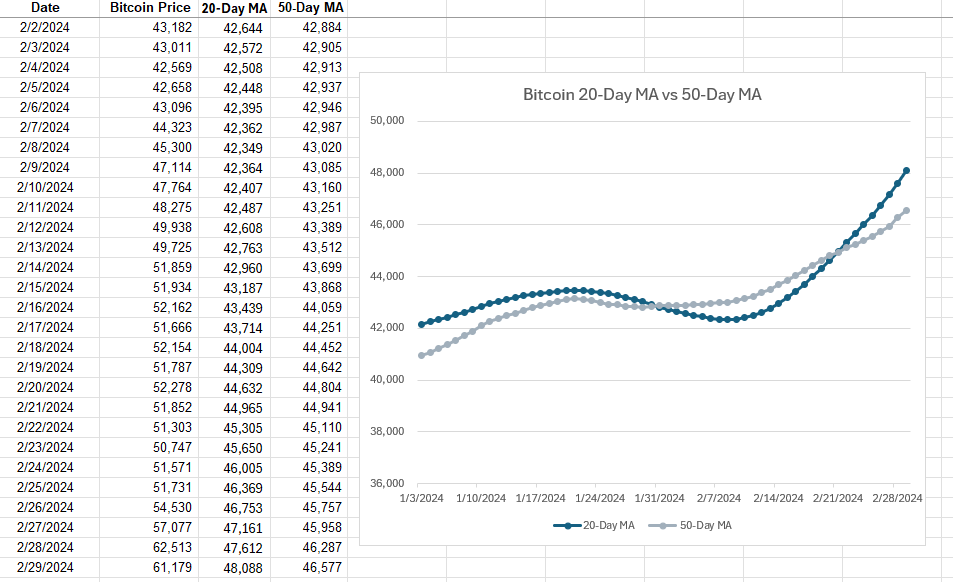
In this example, the 20-day MA made a bullish crossover recently, going higher than the 50-day MA. This is a very bullish trend. However, with simple moving averages, these trends can take a while to develop, and that is one of the drawbacks of using them — they are slower to react to recent price movements.
How to Calculate an Exponential Moving Average (EMA) in Excel
The exponential moving average (EMA) gives more weight to recent prices, making it more responsive to new information, and thus, there’s less of a lag effect; changes and crossovers can occur much more rapidly. This characteristic makes the EMA a preferred choice for many traders, especially those looking to capitalize on short-term trends.
Here’s how to calculate an exponential moving average in Excel:
- Determine the number of periods, as you did with the simple moving average.
- Calculate a multiplier, using the formula 2 / (period +1). In the case of a 20-day MA, the multiplier would be 0.095, which is 2/(20+1).
- Calculate the moving average for the first period. The very first period needs to be a simple moving average.
- For every value afterwards, you’ll use the following formula: =Multiplier x (Current Price – Previous EMA) + Previous EMA.
Here’s how this would be calculated with the price of Bitcoin, as in the previous example:
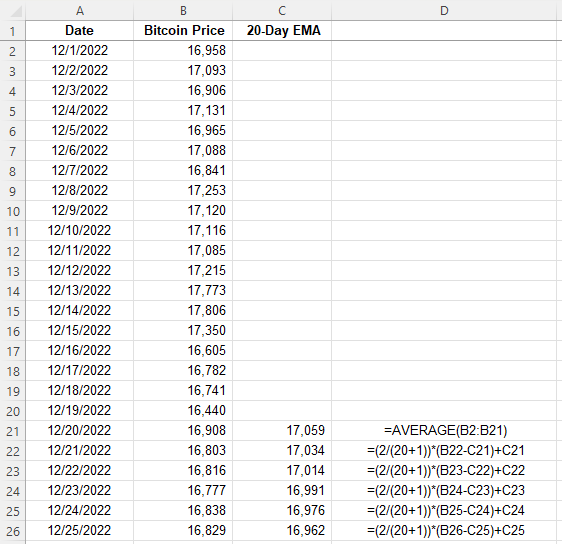
After the initial moving average, the subsequent averages are calculated using the weighting. Here’s a side-by-side comparison of how the 50-day EMA compares with the 50-day MA. I’m using 50-day averages here since they are normally slower to see movements in. But by using an EMA, that can help expedite trends.
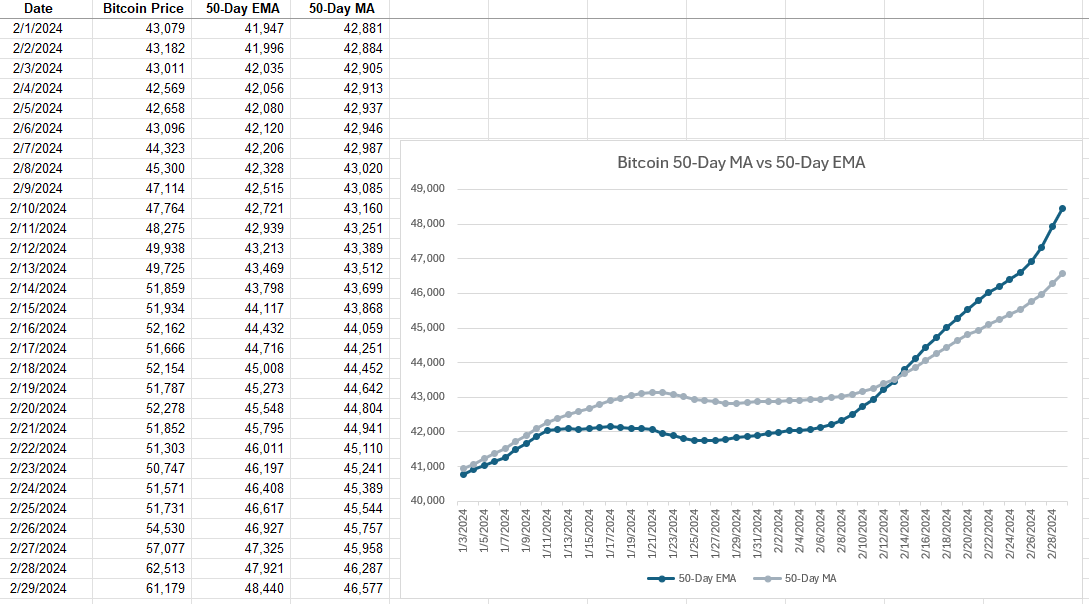
The 50-day EMA makes quicker, more rapid movements and is changing more frequently while the 50-day MA is smoother and more gradual in its changes. With Bitcoin’s price rising rapidly in recent weeks, that uptrend is observed more immediately with the EMA than with the simple MA.
Which Should You Use: MA or EMA?
While both MAs and EMAs provide valuable insights into market trends, the choice between them depends on the specific needs of the trader or analyst. MAs are best suited for identifying long-term trends, as they smooth out price fluctuations evenly. In contrast, EMAs are ideal for those looking to react quickly to recent price changes due to their emphasis on newer data.
By understanding the differences between these two types of averages and knowing how to calculate them in Excel, investors and analysts can better tailor their strategies to suit their goals. Whether it’s the simplicity and broad trend identification of the MA or the responsiveness of the EMA to new information, both tools can be useful.
If you liked this post on What Is the Difference Between a Moving Average and an Exponential Moving Average, please give this site a like on Facebook and also be sure to check out some of the many templates that we have available for download. You can also follow us on Twitter and YouTube.