The TREND function in Excel is a powerful tool that allows users to perform linear regression analysis and make predictions based on existing data. This function is particularly valuable for professionals dealing with data analysis, financial modeling, and forecasting. In this article, I will go over how the function works, and provide step-by-step instructions on how to utilize it in your Excel worksheets.
Using the TREND function
To use the TREND function, follow the steps below:
1. Organize the data
Before you can use the function, you need to have your data organized so that it includes at least two columns. One needs to be for the independent variables, or the x-values, and another one for the dependent variables, or y-values. It is necessary for the data to be aligned correctly so that the information correctly relates to one another (i.e. you don’t want the wrong values lined up next to one another).
Below is sample data for a company which sells seasonal products. In warmer weather, revenue rises while in cooler temperatures, sales are lower.

2. Calculate the Trend Line
With the data populated, you can now enter it into the TREND function in Excel. This involves specifying the following arguments:
- known_y’s
- known_x’s
- new_x’s
- constant
In the above example, the known_y’s are the sales, the known_x’s are the average monthly temperatures. If I don’t fill in any new_x’s or specify the constant, the function will still try and plot out the rest of the values:

The problem in this scenario is that it doesn’t take into account the temperature; it simply assumes a similar trend as before. The function is much more useful if I have forecasted monthly temperatures. That way, the trend calculation will take that into account. Suppose I fill in the data, telling Excel that I expect the temperatures to be much warmer over the next 12 months:

With the previous forecast off to the right, you can see that the TREND function has adjusted to reflect the newer information. Thus, the more data you plug into the function, the more reliable the forecast will be. Otherwise, it will simply assume the same patterns will repeat from before, which may not necessarily be the case.
There is an additional argument in the function that you can also adjust, and that is the constant. If you set it to false it will be 0. If set to true, then the formula will calculate it. This is the b variable which is part of the y=mx+b equation. If you expect there to always be a minimum, a constant amount, then you may want this to be calculated. If, however, the data can fluctuate wildly, then you may want to set it to true so that there is no intercept. Here’s a comparison with the above data both when there is a constant and when there isn’t:

The forecast in green is where the argument is set to false (constant is set to zero) and blue is where it is true and a constant is calculated. From the chart below, you can see that there isn’t a big difference but the highs are higher and the lows are lower when there is a constant. This may, however, not always be the case as it will depend on your individual data set.

Create a chart to differentiate between actuals and forecast
One thing you may find helpful to do when creating a forecast is to put those amounts on a different column:

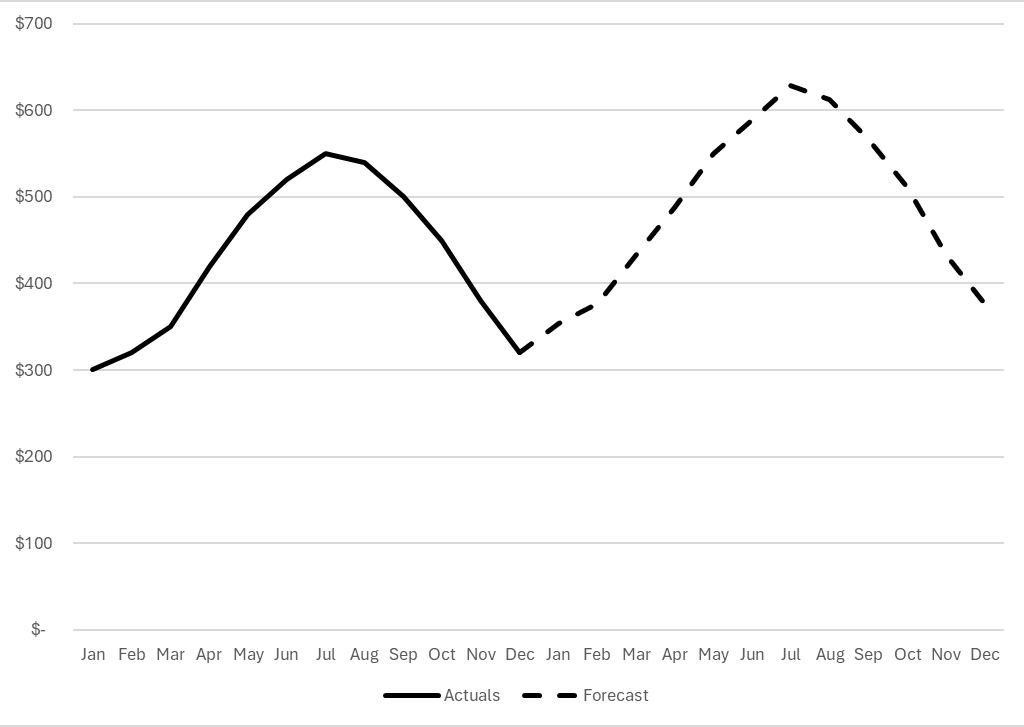
By doing this, you leave yourself space to add actuals later on and to compare them against your forecast. You can also create a chart with the forecast being a different series. In the below chart, I have used a dotted line to show the forecast while the actuals remain solid. For the first forecast amount, I set it to the same as the actual. This way, when I create the chart below, there are no gaps and it is merely a continuation of the line.

If you liked this post on How to Use the Trend Function in Excel, please give this site a like on Facebook and also be sure to check out some of the many templates that we have available for download. You can also follow me on Twitter and YouTube. Also, please consider buying me a coffee if you find my website helpful and would like to support it.

