

In previous posts, I went over how to calculate the internal rate of return and how to discount future cash flows to arrive at a net present value. Today, I’ll go over another way you can evaluate projects, and that’s using the payback period. The payback period calculation is a simpler method than the other two approaches in that it just looks at how long it’ll take for you to recoup your money from an investment, or when you’ll hit breakeven.
Setting up the spreadsheet
To do this calculation, I’ll again use the discounted cash flow spreadsheet from my earlier example. The key difference in calculating the payback period is that you don’t need to worry about present value since this won’t take into account the time value of money.
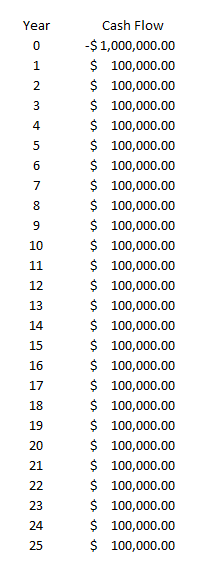
Let’s assume a scenario where you invest $1,000,000 into a project and generate cost savings of $100,000 every year. Here’s how that might look like over a 25-year period:
This is a really simple setup but let’s set up a formula to determine when the investment reaches breakeven. In this scenario, since the cash savings are always $100,000 every year, you can simply take the initial investment and divide it by the annual cost savings. The formula looks as follows:
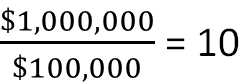
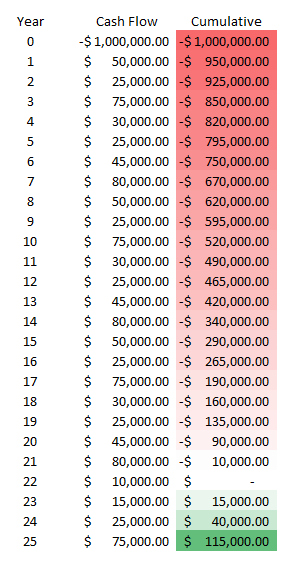
After 10 years, the investment will be paid back in its entirety and reach breakeven. If your cash flows will vary over the years, what you can do is use an average to try and smooth it out and get to an approximate payback period. Another alternative is to create another column that shows your cumulative savings or cash inflows and how much is left to reach breakeven. To calculate a cumulative sum, just use a regular summation formula but freeze the first cell so that your formula will always start from the same position. Here’s how you might set this up:
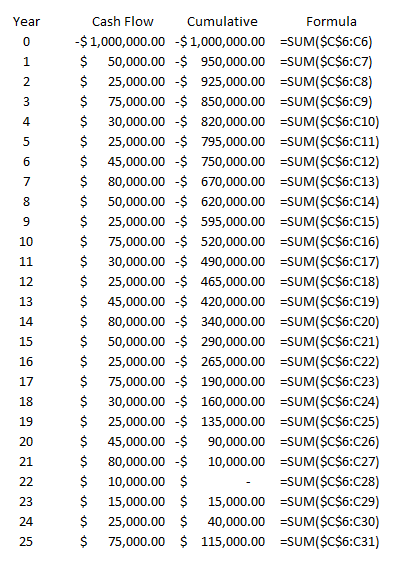
You’ll see that cell C6 is frozen as that’s where my first value is, and that’s where the $1,000,000 outflow of cash is. I’ve also changed my cash flows so that they’re different amounts each year, and under this scenario, you’ll notice that it’s not until year 22 that I reach breakeven. A better way to illustrate this is through conditional formatting, by highlighting the negative values and the positive ones in different colors.
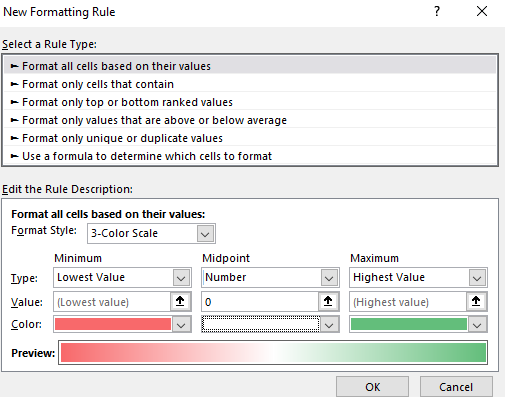
You can do this by selecting all the values in the cumulative field and under Conditional Formatting, selecting Format all cells based on their values, which gets you to this menu:
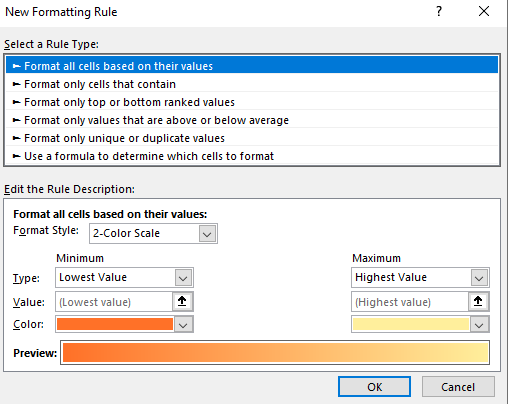
The first thing I’ll do here is to change the color scale so it shows three colors instead of just two. Then, I’ll set it up so that the lowest value is red, the midpoint is set to 0 and white, and the maximum is set to green:
Then, after clicking on OK, my values look like this:
Using the conditional formatting, I can easily see the progression of the red into white (breakeven), and then into green. It’s a lot easier on the eyes and allows you to quickly see the progress. If you want to look into more ways you can do this, check out this post on conditional formatting.
Payback period when factoring in time value
If you just want to calculate the payback period using a simple formula and your cash flow / savings is the same every year, then simply dividing your total investment by that amount will suffice. Then, it’s simply a matter of determining whether the number of years in the payback period is acceptable to you. If it is, you can move forward with the project. If the payback period is too far into the future, then you may want to re-consider it.
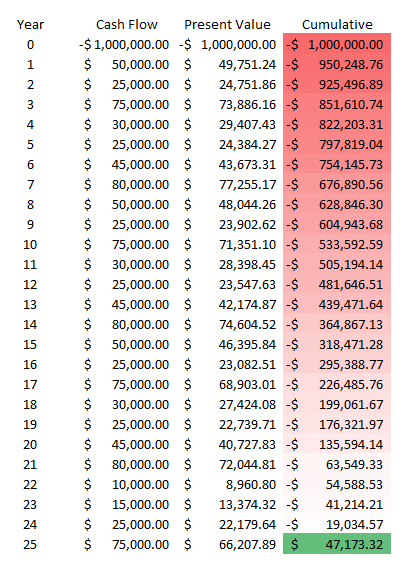
However, when you’re looking at a longer timeframe, you may want to consider incorporating discounted cash flow to give you a more realistic picture of the payout period over time. And while the typical payback period calculation doesn’t incorporate the time value of money, that doesn’t mean you can’t do it. In this example, I’ll calculate the present value of the cash flows like I did in the earlier post which looked at discounted cash. Using a discount rate and raising the cash flow to a negative power (years in the future), I can arrive at the present value. Here’s how that looks in an additional column, with the respective formulas off to the right:
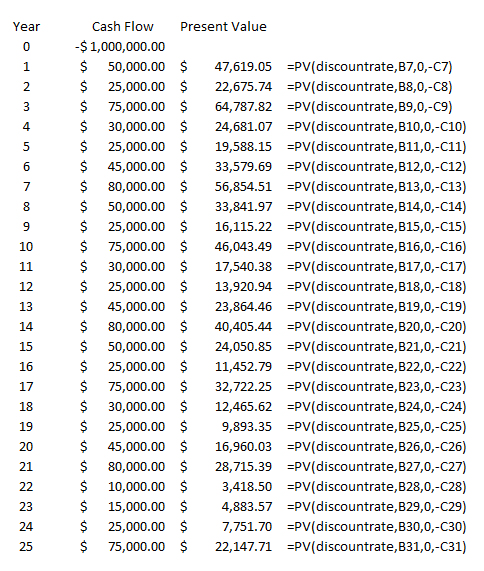
Note that I used a named range for the discount rate. Column B relates to the Year field and Column C is the cash flow value in the future.
This time I use Excel’s built-in present value function, which requires you to enter the rate, the number of periods, payments (not applicable here), and the future value (which needs to be negative for this to calculate correctly). Using a 5% discount rate, I’ve populated the present values of each of the future cash flows.
Now, I can add a column to track the cumulative values:
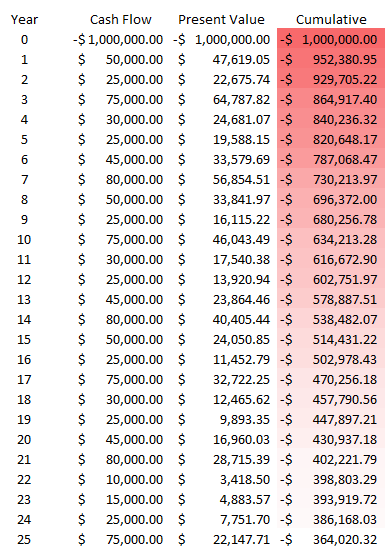
When factoring in the time value of money, my payback period is now well over 25 years. It’s an important reminder of just how important time value is. Under the previous payback period calculation that didn’t factor in the time value of money, the payback period was 22 years. In order for my payback period in this example to get to breakeven within 25 years, I’d have to set my discount rate to less than 1%. At 0.5%, this is what the schedule looks like:
Only after 24 years does the project attain breakeven in this situation, and that’s with a minuscule discount rate. Normally, in a payback period calculation, you’ll just stick to the investment total divided by the savings or cash flow that the investment will generate. However, there are significant drawbacks to doing so when it may take many years for an investment to breakeven. In that case, it may be worthwhile to consider the time value of money.
If you liked this post on how to calculate payback period in Excel, please give this site a like on Facebook and also be sure to check out some of the many templates that we have available for download. You can also follow us on Twitter and YouTube.
Add a Comment
You must be logged in to post a comment