sddefault

How to Break Ties in Excel and Rank with Multiple Criteria

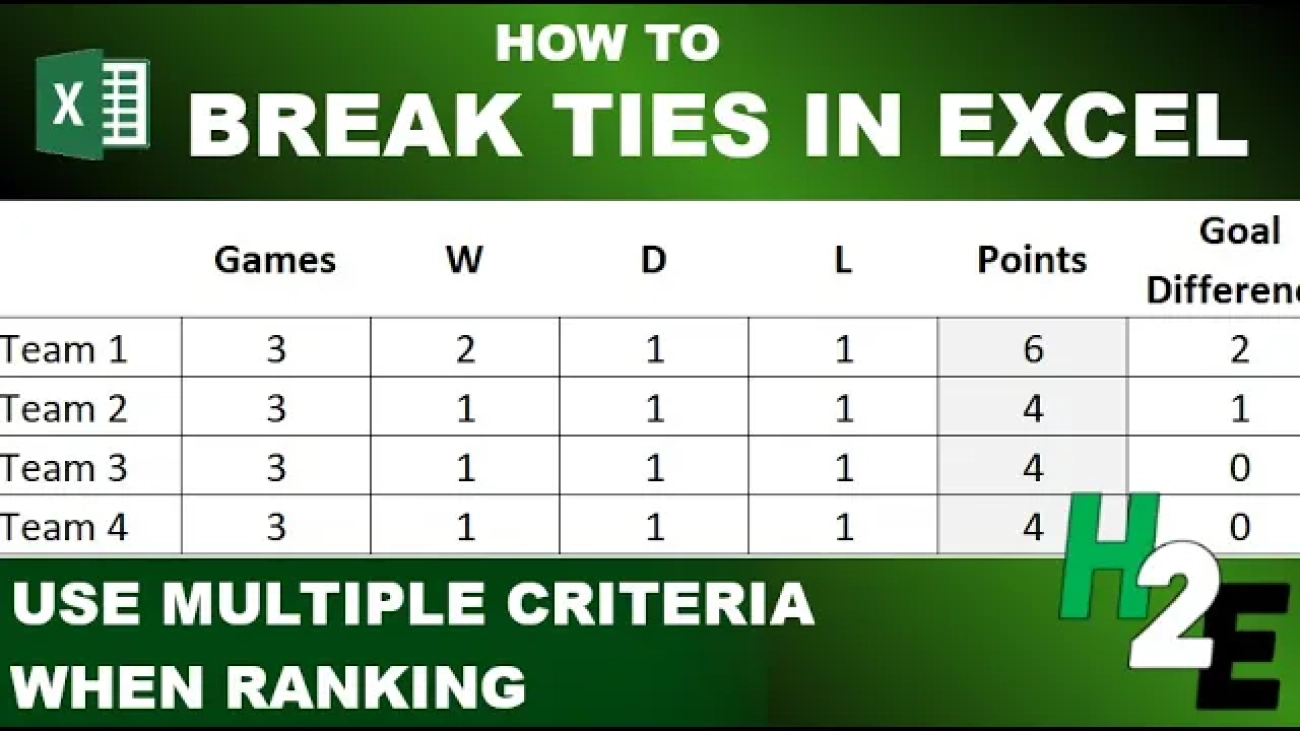
If you’re tracking standings in Excel, you know it can be challenging to ensure that you have your rankings setup correctly, especially when factoring in multiple criteria. Ranking values based on a single column or field isn’t complex, but when you start to factor in multiple conditions, it can get a little bit more complicated. Here’s a scenario I’ll attempt to solve where multiple teams have the same number of points, but where their goal difference isn’t the same:

Table showing team standings.

By using an additional criteria as a tiebreaker, you can ensure you rank the teams properly. But how do you setup the formula, and what if you also want to factor in more columns and use a method which can be used for more complex situations? That’s what I’ll go over in this post.

Using the Rank function

If you were to rank these teams based on points, you would use the RANK function. You would use the value in the points field and rank it based on those values. If my first value is in F2 and the range for the points field is F2:F5, my formula would be as follows:

=RANK(F2,$F$2:$F$5)

The limitation of this method is that it will result in repeating values since multiple teams have 4 points:

Table showing team standings with a field for a simple rank.

How to use multiple criteria in your ranking calculations

The RANK function only allows us to base the calculation on a single field. But there is a way we can still rank the values based on multiple fields. This involves using multiple functions, and fractions. Assuming the key criteria is points, then the current formula can be kept as is. But let’s assume the second criteria is goal differential. Then, we can rank the teams based on this field, but divide the value by a factor of 10. Here’s what the formula would look like assuming goal difference is in column G:

=RANK(G2,$G$2:$G$5)/10

This then gets added to the original formula:

=RANK(F2,$F$2:$F$5)+RANK(G2,$G$2:$G$5)/10

Based on this calculation, now my formula shows an additional decimal point and I can now rank the fields based on a second field:

Table showing team standings with a field for a rank based on multiple criteria.

And now I can re-sort the data based on the rank, which correctly tells me that Team 4 is in second place when ranking them based on points, and then goal difference.

A sorted table showing team standings with a field for a rank based on multiple criteria.

You can extend this logic to more criteria and fields. Let’s assume a more complicated scenario where the goal difference for the tied teams is 0. And instead, it comes down to a third criteria, which is their fair play score:

Table showing team standings with additional criteria for fair play scores.

Assuming Fair Play is in column H, here is my updated ranking calculation:

=RANK(F2,$F$2:$F$5)+RANK(G2,$G$2:$G$5)/10+RANK(H2,$H$2:$H$5)/100

In this situation, Team 2 will have the second-best ranking because it has the best fair play score.

A sorted table showing team standings with a field for a rank based on three criteria.

My ranking calculation now has yet another decimal place and another criteria which it can factor into its calculation. You can also adjust the criteria if, suppose, the lowest score for Fair Play is the best. Let’s say the lower the Fair Play score, the better the team should rank. In that case, we can adjust the formula so that we specify the rank should be in ascending order for that last criteria (the default is descending order):

=RANK(F2,$F$2:$F$5)+RANK(G2,$G$2:$G$5)/10+RANK(H2,$H$2:$H$5,1)/100

I just needed to add the final argument to the last criteria, setting it to 1. And now when I re-sort the rank, Team 4 gets the second spot:

A sorted table showing team standings with a field for a rank based on three criteria and when factoring in ascending order.

By setting up your ranking calculation this way, you can have the flexibility of adding more fields and criteria into your ranking. If you want to add another field, simply add it to your formula and divide that value by 1000, and so forth.


If you like this post on How to Break Ties in Excel and Rank with Multiple Criteria, please give this site a like on Facebook and also be sure to check out some of the many templates that we have available for download. You can also follow me on Twitter and YouTube. Also, please consider buying me a coffee if you find my website helpful and would like to support it.

ExcelLeaderboard

How to Create a Leaderboard and Track Standings in Excel

Creating a leaderboard in Excel is a great way to visually rank and compare performance, whether it’s for sales, gaming scores, or any other competitive metrics. Below, I’ll guide you through the process of creating a basic leaderboard in Excel. Here’s a table which shows player scores based on points, kills, and deaths.

A table in Excel showing player points, kills, deaths, games played, and a kill/death ratio.

Setting up a scoring system

If you just have a single metric for points to sort a leaderboard on, then all you need to do is sort the data. But in more complex situations, you may want to apply weights to calculate a score, which you can then sort. In the above table, there are points, and a kill/death ratio would could be useful in determining a total score.

You may for example, want to multiply the points total by a factor of 0.5 and multiply the kill/death ratio by 2, to get a combined score which considers both metrics. Assuming the points value is in column C and the kill/death ratio is in column F, here is how the formula for the score would look, starting with the first value in the second row:

=C2*0.5+F2*2

By calculating a weighted average, you are effectively creating a tiebreaker in the situation where the points are the same. In this example, Player 1 and Player 2 have the same points. But with a better kill/death ratio for Player 2, that player earns the higher score.

A leaderboard in Excel showing scores by player.

Ranking the top players

The above table isn’t sorted according to score. To sort the leaderboard, all you need to do is to click a value in the score column, and on the Data tab, click on the button to sort the values in order from Largest to Smallest. This now gives us a list that has sorted the players in order of their scores.

A leaderboard in Excel sorted by score.

To refresh the data, simply click on the sort button again, which will re-sort the data.

Another option to sort the data is by using the SORTBY function. If you’re running the latest version of Excel, you’ll have access to this function. Here’s how you would enter the formula assuming the data is in a table called Table1:

=SORTBY(Table1[Player],Table1[Score],-1)

This returns a single array of data showing the player standings:

The benefit of using this formula is that the data will automatically re-sort the leaderboard for you; there is no need to click a button to sort. Since it is an array function, it will update as you enter updated values.

If you want to return the entire sorted table, you can use the following formula:

=SORTBY(Table1[[Player]:[Score]], Table1[Score], -1)

Here is what the array looks like, with some additional formatting added to it:

You can add conditional formatting to help identify high-performing players.


If you like this post on How to Create a Leaderboard and Track Standings in Excel please give this site a like on Facebook and also be sure to check out some of the many templates that we have available for download. You can also follow me on Twitter and YouTube. Also, please consider buying me a coffee if you find my website helpful and would like to support it.

Ranks in Excel: Breaking Ties

The RANK() function in Excel is limited to a single range and if you do not have a set of unique numbers to use the rank function on it will return repeating values.
There is a workaround however. If you can afford an extra column for a ‘rank total’ then it will be easy to accommodate. Or you can use an array formula.
The easiest example in creating a rank total column is to look at standings in sports:
Team
W
Points
GF
GA
Goal Differential
Team A
5
15
20
5
15
Team B
4
12
19
18
1
Team C
6
12
12
7
5
Team D
4
11
17
15
2
In this scenario I’m going to say the rank order will first be by points, the first tiebreaker will be wins, followed by goal differential. My rank total formula will be as follows: Points + wins/100 + goal differential/10,000. I’ve broken out how the values look and after totaling them:
Team
W
Points
GF
GA
Goal Differential
Win Value
Differential Value
Rank Total
Team A
5
15
20
5
15
0.05
0.0015
15.0515
Team B
4
12
19
18
1
0.04
0.0001
12.0401
Team C
4
12
12
7
5
0.04
0.0005
12.0405
Team D
4
11
17
15
2
0.04
0.0002
11.0402
For Team A, their rank total is made up of 15 (points), .05 (wins) and .0015 for goal differential. If the factor for goal differential was only 1,000, then goal differential adds 0.015 and now it affects the decimal position for wins and has the same effect as a sixth win, which is wrong. So you want to choose your factors carefully so as not to effect the higher ranking tiebreaker. If goal differential was only ever single digits then you could have used a denominator of 1,000 instead of 10,000.
The result of this rank total tells me Team C should be ranked higher than Team B because both teams have the same points, same wins, but Team C has the higher goal differential.
Now what you can do to pull the ranks is use the following formula:
RANK(ranktotalvalue, ranktotalcolumn)
Or if you want to put the name of the teams in order of their rank rather than just saying Team A is in position 1, then you can use the index and match functions as follows. Assume the Team column is column A and the rank total is column I:
=INDEX(A:A, MATCH(LARGE(I:I,ROW(A1)),I:I,0))
Let’s break down this formula:
=INDEX(A:A
This tells the formula I want to extract the value from column A.
LARGE(I:I,ROW(A1))
This extracts the largest value in column I. The reason I use ROW(A1) instead of the number one is because now if I drag this formula down the relative reference will become ROW(A2), ROW(A3), and ROW(A4) which then looks for the second, third, and fourth largest values respectively.
MATCH(LARGE(I:I,ROW(A1)),I:I,0)
This formula looks for where the value matches the result of the large formula calculation. Where that match is made, the related value from column A is returned. And the following list is generated:
Team A
Team C
Team B
Team D
This correctly puts Team C ahead of Team B in the rankings.
WHAT IF I DON’T HAVE ANY TIEBREAKERS?

If you do not have any tiebreakers then what you can do is pull them in the order that they appear. If you want them to be in ascending or descending order, then you will first need to sort the data in such a way.
In this case, you can calculate your rank total using a value for the row the values are on. The formula for the ‘row value’ would be calculated as follows: 1/(ROW()*100).  The fraction is used to make sure the rows higher up will appear first. I multiple the denominator by 100 to push it further down the decimal location. Below is how my rank totals now look:
Team
W
Points
GF
GA
Goal Differential
Row Value
Rank Total
Team A
5
10
20
5
15
0.005
10.005
Team B
4
12
19
18
1
0.003333333
12.00333333
Team C
4
12
12
7
5
0.0025
12.0025
Team D
4
11
17
15
2
0.002
11.002
I changed Team A’s point total to 10 for the sake of this example. Now the top two ranked teams (B and C) both have 12 points. Because B is in a higher row and thus shows up before C, it has a higher row value which in turn gives it a higher total rank value. So the correct order now is Team B, Team C, Team D, and Team A.
THE FORMULA METHOD

Now if you don’t have the luxury to put an extra column in your worksheet, you can certainly do this in a formula, although it won’t be pretty. Essentially you’ll recalculate the rank total and search through the values using an array formula.
To recalculate the rank for the non-tiebreaker method:
{=INDEX($A$2:$A$5,MATCH(LARGE(($C$2:$C$5)+(1/(ROW($G$2:$G$5)*100)),ROW(A1)),$C$2:$C$5+(1/(ROW($G$2:$G$5)*100)),0),1)}
The INDEX formula again looks at the Team column while looking for the largest value when adding the points value to the row value. The calculation for the row value is the same as above just now dumped into a formula. An array formula has to be used to ensure each team’s results are looked at individually.
For the multiple tiebreaker scenario from above, the formula will be longer to accommodate for all the extra tiebreakers it has to look at:
{=INDEX($A$2:$A$5,MATCH(LARGE(($C$2:$C$5)+($B$2:$B$5/100)+($F$2:$F$5/10000),ROW(A1)),(($C$2:$C$5)+($B$2:$B$5/100)+($F$2:$F$5/10000)),0),1)}
Again, same logic and formulas are involved except without a rank total column it has to be done in an array. The results yield the same order as through adding an extra column.