HowtoExcel.net
cropped-h2e100x100.png

HowtoExcel.net

Analytics. Automation. Process Improvement.

  • Home
  • Blog
  • Templates
  • Tools & Calculators
    • Average Down Calculator
    • Compounded Annual Growth Rate Calculator
    • Inflation Calculator
    • Investment Growth Calculator
    • Live T-Account Template
    • Minimum Payment Calculator
    • Money Spent Calculator
    • Mortgage Payment Calculator
    • Mortgage Payment Calculator — Interest Rate Sensitivity
    • Mortgage Payment Sensitivity Calculator
    • Price-to-Earnings P/E Calculator
    • Stock Average Calculator
    • Time Spent Calculator
  • Shop
  • Cart
  • Contact Me

H2Eextractnumbers

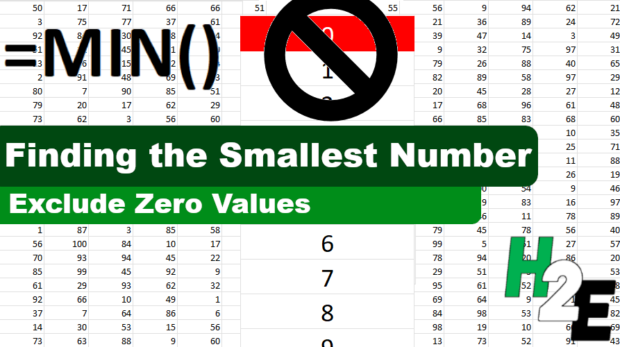
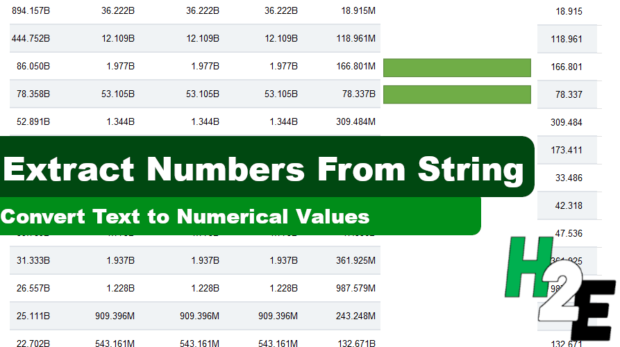
Extract Numbers From a String of Text

January 1, 2022
by howtoexcel parse

Oftentimes when you're working with a large range of values, it can be useful to add letters such as 'B' to indicate billions or 'M' to show millions. It can save space and be easier to read without too many zeroes. But if you want to perform any an ...

Read More
0
H2Eflipdata

How to Flip a Table in Power Query

December 24, 2021
by howtoexcel power query

Do you want to change how your Power Query table looks? In this post, I'll show you how you can flip your data so that you can turn a table that looks like this: Into this: In the second table, it's a bit easier to see all your fields ...

Read More
0
H2Etogglebutton

How to Create a Toggle Button on the Excel Ribbon

December 17, 2021
by howtoexcel macrosribbonvba

In a previous post, I went over how to modify the Excel ribbon with some basic buttons. This time, I'm going to focus specifically on a toggle button that can change the value of a cell or trigger a calculation or macro. In this example, I'll show y ...

Read More
0
H2Epieofpie1

How to Make a Pie of a Pie Chart

December 11, 2021
by howtoexcel charts

A pie chart can be a great way to show percentages, such as how much significant an individual's product sales are to the total number. However, if you're dealing with more than 10 items, a pie chart can start to get a bit messy. But there is a way ...

Read More
0
H2Ebuffett

Track Warren Buffett’s Portfolio Using Power Query

December 4, 2021
by howtoexcel investingstocks

Billionaire investor Warren Buffett is the CEO of Berkshire Hathaway. And what trades his company is making is always big news among his followers and fans. In this post, I'll show you how you can use Excel, and specifically Power Query, to determin ...

Read More
0
H2Esmallestnonzero

Find the Smallest Non-Zero Value in Excel

November 27, 2021
by howtoexcel arrayslargemin

Do you need to find the smallest value but want to skip over any zero values? In this post, I'll show you how you can do just that. The MIN function in Excel does a good job of finding the lowest value but if you have any zero values, those will get ...

Read More
0
H2Estockcharts

Create Stock Charts in Excel Using Power Query

November 17, 2021
by howtoexcel chartsstocks

In Excel, there are multiple different stock charts you can create. All you need is some combination of the date, opening price, high price, low price, closing price, and volume to generate what you need. In this post, I'll show you how you can util ...

Read More
0
H2Eforecastrange

How to Make a Forecast Chart Showing a Range of Possible Values

November 10, 2021
by howtoexcel chartsforecastingformatting

In a previous post, I showed how to make a forecast chart in Excel with a dotted line. This time around, I'm going to go one step further and show you how to create a chart that shows a range of possible values. This is useful in the event that you ...

Read More
0
H2EForecastChart

How to Make a Forecast Chart in Excel With a Dotted Line

November 4, 2021
by howtoexcel chartsforecastingformatting

Charts are an effective tool in forecasting. In this post, I'll show you can show you can make an actual and forecast chart in Excel look like one continuous line chart, with the forecasted numbers being shown on a dotted line. https://youtu.be/ ...

Read More
0
mark-g9a0a06435_1280

5 Top Canadian Dividend Stocks to Buy for November 2021

October 29, 2021
by howtoexcel investingstocks

Excel can be a useful tool in helping you make investment decisions. And in this post, I'll use it to show you five excellent dividend stocks that you can buy on the Toronto Stock Exchange (TSX) that can help generate some strong recurring income fo ...

Read More
0
LOAD MORE
LOADING
cropped-h2e100x100.png

HowtoExcel.net

Analytics. Automation. Process Improvement.

© 2019 Company. All rights reserved.  Powered by  Phlox Theme

Shopping Basket

HowtoExcel.net

  • Home
  • Blog
  • Templates
  • Tools & Calculators
    • Average Down Calculator
    • Compounded Annual Growth Rate Calculator
    • Inflation Calculator
    • Investment Growth Calculator
    • Live T-Account Template
    • Minimum Payment Calculator
    • Money Spent Calculator
    • Mortgage Payment Calculator
    • Mortgage Payment Calculator — Interest Rate Sensitivity
    • Mortgage Payment Sensitivity Calculator
    • Price-to-Earnings P/E Calculator
    • Stock Average Calculator
    • Time Spent Calculator
  • Shop
  • Cart
  • Contact Me