Scroll further down if you would like to see details as to how this calculator works and a description of it.
There is a new version of this calculator available here (mobile-friendly) that will make calculations at multiple price points at once (use the new interval field to specify how much in price you want to jump by). It will also let you know how low you can average down at the current share price.
If you invest in stocks and want to know how much it would cost you to average down, this calculator will help you do just that. Averaging down is a great way to take advantage of a stock that’s dipped in value and that you’re confident won’t stay there. By purchasing more shares of a stock at a lower price, you’re bringing down the average cost of your total investment. And that means you’ll need the stock to rise to a lower price than before to turn a profit. Or if you’re already in the black, then you can put yourself in a great position to increase those profits.
How the average down calculator works
To use this calculator, you’ll need to enter the total dollars that you’ve invested in a stock, how many shares of it you own, what the current price of the stock is today (or the price that you plan to buy it at), as well as what price you want to average down to. Then, click on the Calculate button. The calculator will then tell you how many shares you’ll need to buy and how much it will cost you in order for you to get to that average.
Note that since you can’t average down below what the current share price is, you’ll have to make sure that your desired average price is higher than where the stock is today. Here is the calculator:
If you liked this free average down calculator, please give this site a like on Facebook and also be sure to check out some of the many templates that we have available for download.
A tax-free savings account (TFSA) is a very useful tool for Canadian investors to shield investment gains and dividend income from taxes. However, it can be challenging to keep track of the rules and just how much you’re able to contribute and what your TFSA limit is for the year.
How much can I contribute to my TFSA in 2025?
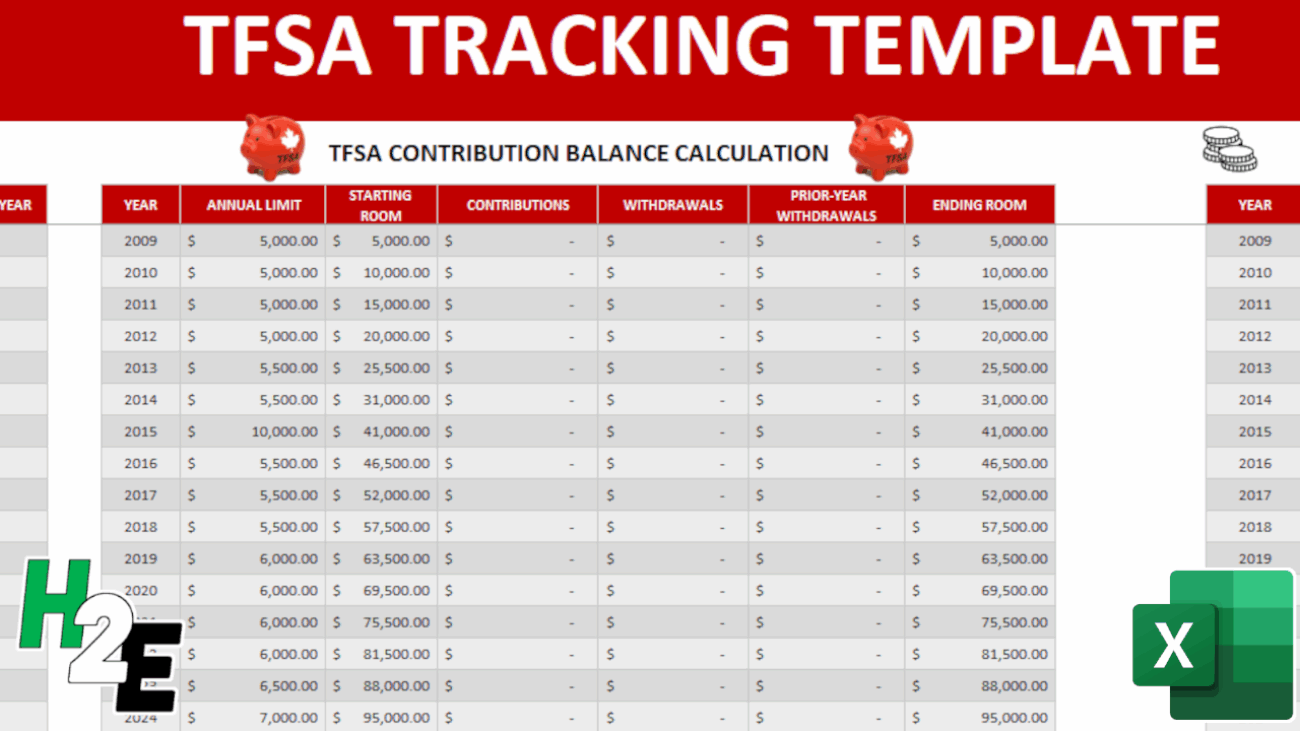
For 2025, the annual contribution limit for the Tax-Free Savings Account (TFSA) is $7,000. This amount is set by the federal government and can increase over time due to indexation for inflation. If you were at least 18 years old in 2009 (the year the TFSA was introduced) and have never contributed, your total available contribution room as of 2025 would be $102,500. That total includes all annual limits from 2009 through 2025. Your personal contribution room may be lower if you’ve contributed in previous years, or higher if you made withdrawals in earlier years, since withdrawals get added back to your room at the start of the following calendar year.
It’s important to note that unused contribution room carries forward indefinitely, so you don’t lose it if you don’t max out your TFSA each year. This flexibility makes the TFSA one of the most powerful investment vehicles for Canadians, since it allows you to plan contributions around your cash flow without worrying about missing out on available room. To confirm your personal TFSA limit, you should always check your CRA “My Account,” as financial institutions don’t track your overall contribution room across multiple accounts.
Do TFSA withdrawals increase my contribution room?
Yes, TFSA withdrawals do increase your contribution room — but not immediately. Any amount you withdraw from your TFSA is added back to your contribution room starting on January 1 of the following year. For example, if you withdraw $5,000 in 2025, your contribution room for 2026 will increase by $5,000 on top of your regular annual limit. This feature makes the TFSA highly flexible, since it allows you to use the account both for long-term investing and for shorter-term goals where you may need access to your funds.
The key detail to remember is that you cannot re-contribute the withdrawn amount in the same calendar year unless you already have unused room available. Re-contributing too early would result in an over-contribution, which is subject to a penalty tax of 1% per month on the excess. To avoid this, it’s best to track your contributions and withdrawals carefully — or use a TFSA tracker — so you know exactly when that room becomes available again. This rule is one of the most common sources of confusion among Canadians, so understanding the timing is essential to getting the most out of your TFSA.
What happens if I over-contribute to my TFSA?
While it may seem simple to track your balance, there’s one issue that can cause headaches for TFSA holders, and that’s when it comes to withdrawing funds. One of the advantages of a TFSA is that since the funds that are contributed are after-tax, you don’t incur any penalties for taking money out. Unlike with an RRSP, you don’t have to worry about a withholding tax. With a TFSA, you can freely move money in and out of your accounts as you need it.
The caveat, however, is that when you withdraw funds, the contribution room isn’t replenished until the beginning of the next calendar year. And so if your TFSA had been maxed out on July 1st and you had withdrawn $10,000, then that will free up contribution room –- but it won’t be until January 1st. Any withdrawals that are made, regardless of the time of the year, won’t free up space until the beginning of the next calendar year.
That’s where much of the complexity comes into play when it comes to TFSAs. While contributions will reduce your available contribution room immediately, withdrawals won’t make that room available until next year. That lag can create many problems for TFSA holders. That lag can give people the misleading impressing that they have contribution room since they recently took money out, and that’s where overcontributing can happen very easily.
Suppose your TFSA is maxed out (2025 cumulative balance is $102,000) and you pull all the funds out today and they re-contributed them immediately after. In this scenario, you’ve now overcontributed by the entire balance -– meaning you’ll get a 1% penalty on that entire amount, which would amount to $1,020. And that’s just for one month. Leave that overcontribution in your TFSA and those penalties will pile up quickly.
While that may not be a common scenario that will take place, it’s an extreme example that helps to demonstrate just how costly it can be to make a very simple mistake. That’s why simply tracking the balance and looking at contributions and withdrawals is not enough, TFSA holders need to factor in the lag that happens with withdrawals. It’s a small but important detail that can make a big difference in determining how much contribution room you have available.
What this template will help you do
The purpose of this template is to help you keep track of both the contributions you make to your TFSA as well as the withdrawals so that you know what your limit is in a given year. If you’ve got multiple TFSAs and they aren’t all at one financial institution, keeping track of all your transactions can be a challenge. That’s where a spreadsheet can come in very handy; having all your information all in one place can make it much easier to stay on top of your TFSAs.
By logging your transactions each time you make a withdrawal or contribution from one of your TFSAs, you can have a complete picture of your balance at any given time. There’s no limit to the number of transactions you can enter in the template, and this can be used for a running total — forever. And with no macros and a simple, easy-to-use interface, the goal of this template is to make the process as painless as possible.
Use this template to track your TFSA limit
The template itself is very simple to use. There’s an area to enter any TFSA transactions, and while you can start from your first year of eligibility, if you know the contribution room you have as of the start of a specific year, you can start from there.
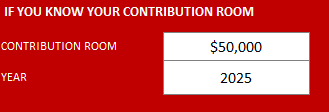
In the header, there is a section where you can specify your contribution room and the year. If for example you’re starting 2025 and you know the contribution room you have is $50,000, this is how you’d enter it:
Upon doing so, the template updates to show the starting room as per that year.
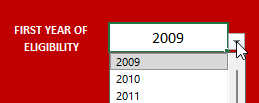
You can, however, start the calculations from your first year of eligibility by selecting from the drop-down list in cell R2:
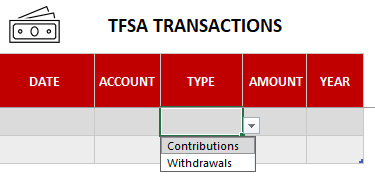
Next, you can specify any contributions and withdrawals from the TFSA transactions table. If you have multiple TFSA accounts, you can enter the specific one in the account tab. The template will total all of the transactions, making it easy for you to stay on top of your total contributions and withdrawals, regardless of which account they originated from. You can keep adding to the list of transactions as you need to and the table will continue expanding.
All the amounts are to be entered as positive. The type of transaction will ensure that the transaction is put into the correct column and update the balance calculation correctly.
What if I go over my TFSA limit?
If the value in ending room field goes negative and indicates that you have overcontributed to your TFSA, the amounts will be highlighted in red (see below). That being said, just because it hasn’t highlighted in red doesn’t mean you’re safe. You should use this as a guide and not an absolute indicator of whether you’re okay or not.
Planning makes perfect
Even if you haven’t made any transactions during the year, what you can do is to enter transactions you expect, or plan to make. Especially if you’re expecting to withdraw funds, you’ll want to budget for that in this template to ensure that it won’t cause a problem for you. Doing some planning beforehand can help prevent problems down the road, and save some costly surprises.
Checking your data
One of the most important things that you can do is to verify that your data is correct.
When in doubt, your best bet is to confirm with the CRA. If you have My Account setup for access online, what you can do is access your balance as of the beginning of the year. While it won’t have all the contributions and withdrawals that you have made since the start of the year, you will have information on your available room as of January 1. This will at least give you a number that you can use as a starting point and then after factoring in your transactions, you can determine what your up-to-date balance is.
Downloading the file
As always, if you want to go ahead and try the file out just keep in mind there are no guarantees that come with it and that when in doubt, you should always verify your information with the CRA especially when it comes to determining how much room you still have available.
The template will not factor in penalties and ultimately the accuracy of it will depend on how up to date your recordkeeping is.
The TFSA Contribution Tracker Spreadsheet is completely free of charge with no limitations. If you like it, please give this site a like on Facebook and also be sure to check out many other templates that are available for download. You can also follow us on Twitter and YouTube.
Unfortunately, there’s no Excel formula that can add stock quotes for you. However, there is a workaround for that which can help you get what you’re after. In a previous post, I covered how to pull stock quotes using Google Sheets which is able to pull in prices and all sorts of other data. And in this post, I’ll show you how to get the data from Google Sheets into Excel.
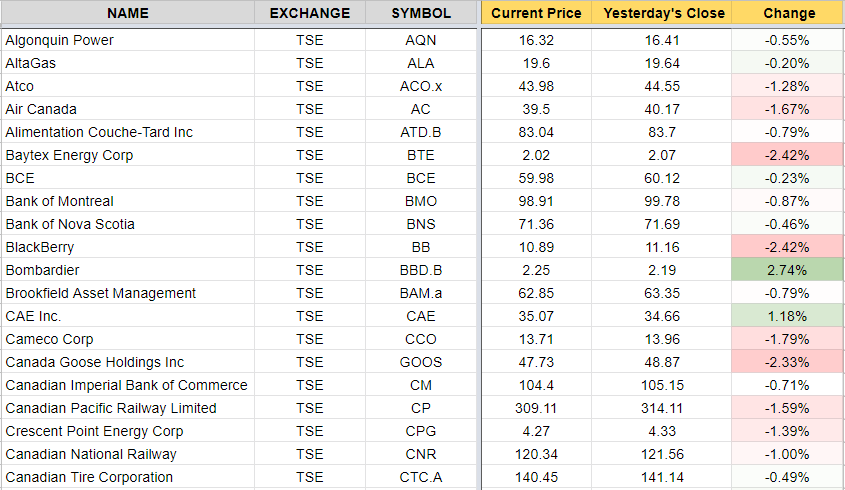
In essence, Google Sheets is your data source or database, and you’re going to import that into Excel. It’s not specific to stock quotes, but it’s an example of how you can accomplish the same thing. So first up, you want to create your file in Google Sheets using that earlier post as a guide. Here’s an excerpt of what my file looks like in Google Sheets:
Once you’re ready, it’s time to link your Excel file to that Google Sheets file, and here’s how to do that:
How to Link Google Sheets to Excel
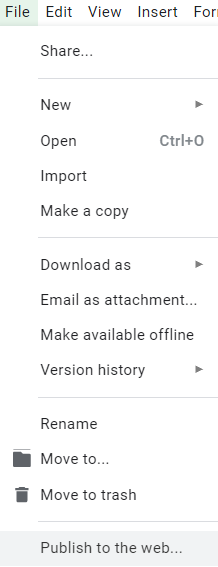
On the File menu, click on the button to Publish to the web
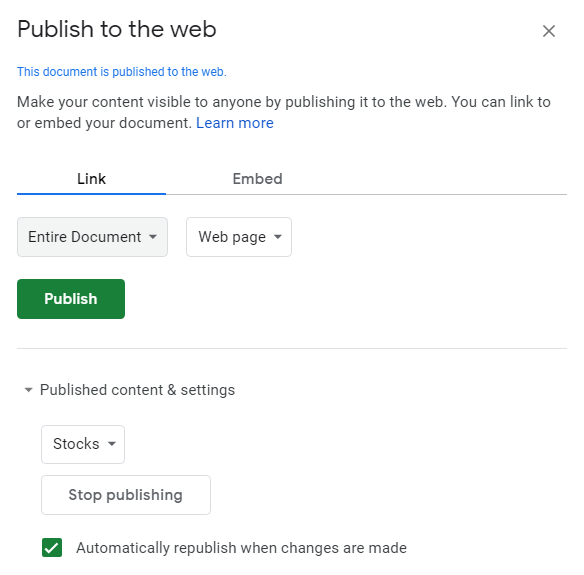
On the next screen, you should see something like this:
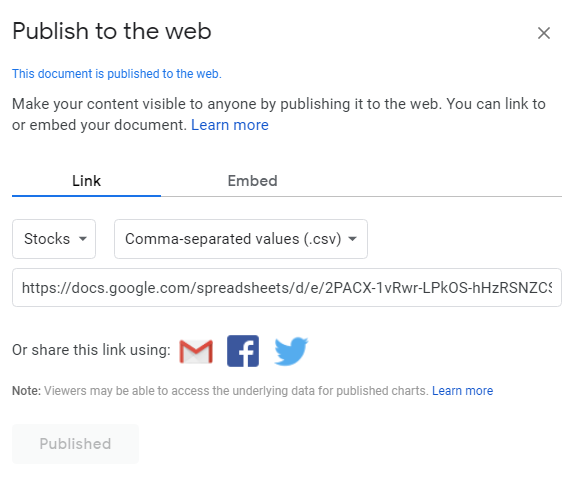
2. Select the tab that you want to export under the Link section and change Web page to Comma-separated values (.csv) and click on the Publish button, that will generate a URL:
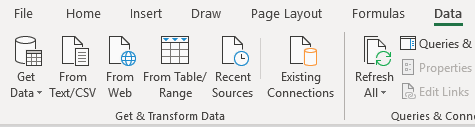
3. Copy the URL that was generated in Step 2 and go back into Excel and under the Data tab click on the From Web button which is in the Get & Transform Data section
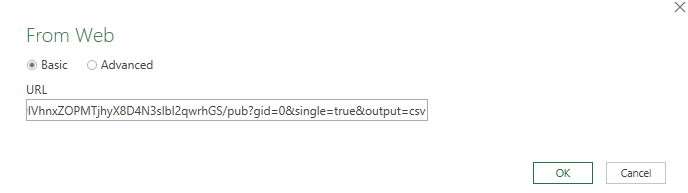
Paste it into the next screen’s URL field and click OK
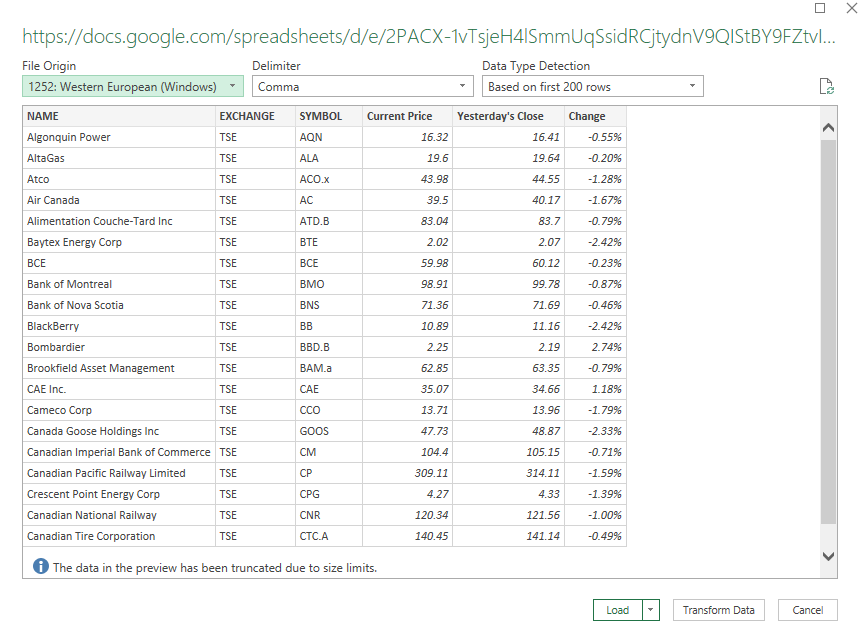
On the next page you should see a preview of your data and if it looks okay then click on the Load button.
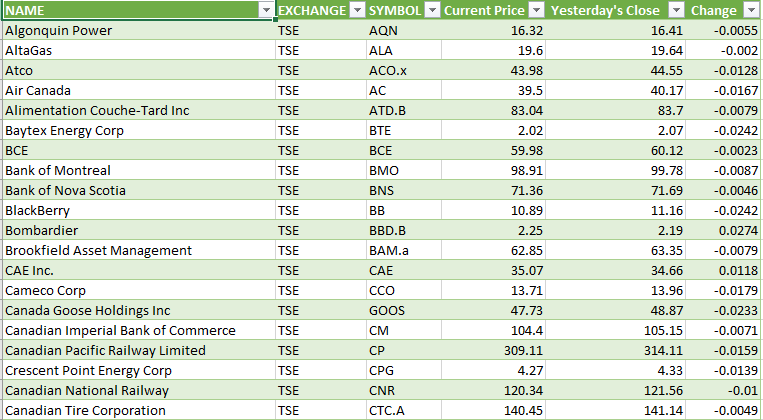
What you should see afterwards is what was on your Google Sheets tab from earlier:
And there you have it, your data from Google Sheets linked into Excel. If you make changes to your Google Sheets file, or if you want to refresh the stock quotes, right-click anywhere in the Excel sheet and select Refresh. Note that sometimes it may take some time before the file is updated on Google Sheets and before you’ll see any changes that you have made to the file.
It may not be an ideal solution if you’re looking to get stock quotes, but it gets the job done and avoids you having to try and find a complex formula or macro to pull the data that you want. You can use the Excel sheet with your Google Sheets data as a database and then lookup the stock prices from another sheet. The benefit of using Google Sheets is that you can have the best of both worlds – putting data online that you can easily update, and not be limited to Google Sheets and be able to edit and manipulate it as you need to in Excel.
Word of caution: if you delete or move around data in Google Sheets it could cause issues, especially if columns are missing and when you go to refresh it cannot find them anymore. If there is an error as a result of it or if you need to change the source, you’ll want to edit the query. When you click on the data in Excel you should see a section for Queries & Connections where you can edit the query. This is where you can select which data you want to include as well as change the source that you are pulling from. However, if it may be easier to just re-publish the data.
If you liked this post on How to Add Stock Quotes Into Your Excel Spreadsheet, please give this site a like on Facebook and also be sure to check out some of the many templates that we have available for download. You can also follow us on Twitter and YouTube.
When you’re doing financial analysis, it’s helpful to add some context to growth numbers. That’s where using a Compounded Annual Growth Rate (CAGR) is very useful. Rather than saying a company has grown 50% over 10 years, you could say instead that they’ve grown by an average of 4.1% every year. It also gives you a percentage to use going forward if you need to forecast what you expect next year’s growth to be since you’ll have a starting point. The CAGR effectively tells you what the average growth rate has been during that period of time. It doesn’t mean that it’s grown every year by that rate, but that on average, it has risen by that amount. Below, I’ll go over how to calculate CAGR in Excel.
Using Amazon as an example
To calculate CAGR what you need to know are just two things: the total growth and the duration of time. Let’s use Amazon’s sales as an example. In 2018, total revenues for the year reached $233 billion. Back in 2010, the company had $34 billion in sales, meaning that Amazon’s revenues have grown by 585% during that time. Impressive, no doubt, but it doesn’t tell us how well it’s typically done on a yearly basis. This is where we calculate CAGR to help determine what the average growth was over that time.
From 2010 to 2018, that’s eight years that it took for sales to grow by 585%. To calculate CAGR, we use the following equation:
(Current Year Amount / Base Year Amount) ^ ( 1 / # of Years)
In the Amazon calculation, it would look as follows:
(233/34) ^ (1/8) – 1 = 27%
What this tells us is that Amazon for the past eight years has averaged an annual growth rate of around 27.2%. There’s an easy way we can prove this out. Starting with our base year of 2010, take the sales amount of $34 billion and multiply it by (1 + growth rate) each and every year. Here is how the level of growth looks like year over year:
Year
Prior Year Revenue
Growth
Current Year Revenue
2010
$34, 000
2011
$34,000
27.2%
$43,248
2012
$43,248
27.2%
$55,011
2013
$55,011
27.2%
$69,973
2014
$69,973
27.2%
$89,006
2015
$89,006
27.2%
$113,215
2016
$113,215
27.2%
$144,008
2017
$144,008
27.2%
$183,177
2018
$183,177
27.2%
$233,000
As you can see, if we assume a 27.2% growth rate each and every year, we arrive to the same end value. Although Amazon did not grow at this consistent of a pace, using CAGR helps to average the results over a period of time.
Whether you’re looking at sales, dividends, or any other kind of growth, using CAGR can be a very useful tool in putting into context just how the strong the rate of growth was.
Using CAGR to help forecast
Having CAGR is also useful if we want to forecast out future sales. Let’s assume that Amazon will have a more modest rate of growth for the next 10 years. That rather than a CAGR of 27.2%, it’ll be closer to 20% instead. Now, we can create a forecast around that and assume that sales will grow by 20% each year (on average) for the next 10. Our forecast would look as follows:
Year
Prior Year Revenue
Growth
Projected Revenue
2019
$233,000
20%
$279,600
2020
$279,600
20%
$335,520
2021
$335,520
20%
$402,624
2022
$402,624
20%
$483,149
2023
$483,149
20%
$579,779
2024
$579,779
20%
$695,734
2025
$695,734
20%
$834,881
2026
$834,881
20%
$1,001,857
2027
$1,001,857
20%
$1,202,229
2028
$1,202,229
20%
$1,442,675
To prove this out, what we can do is the following: 233,000 x (1.20^10) = 1,442,675
Based on these projections, we would expect amazon to hit the one trillion dollar mark in sales by the end of 2026. Maintaining a CAGR of 20%, however, will be difficult, even for a company like Amazon. Although all it takes is some big acquisitions and it will be well on its way!
If you don’t want to calculate CAGR on your own, you can use our free online calculator!
If you liked this post on How to Calculate CAGR in Excel, please give this site a like on Facebook and also be sure to check out some of the many templates that we have available for download. You can also follow us on Twitter and YouTube.
One of the advantages of using Google Sheets over Excel is that it is easier to access live, dynamic data that you can access from any device that can install the app.
Pulling Stock Quotes
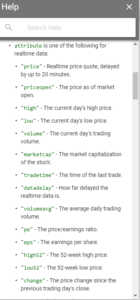
A great feature of Google Sheets is that you can easily pull stock prices (delayed) from Google Finance. There is a unique function called GOOGLEFINANCE that can pull any of the following stock details including price (including open, high, low), volume, even the last time it traded. If I wanted to pull Alphabet’s stock price I could use the following formula:
=GOOGLEFINANCE(“GOOG”,”price”)
That will pull me the most recent stock price. If I wanted to see the percent change since the last day’s close I would just change price to changepct:
=GOOGLEFINANCE(“GOOG”,”changepct”)
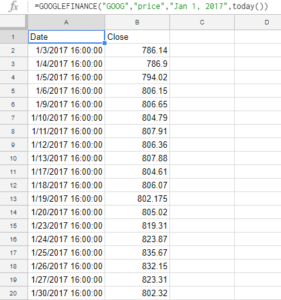
If you access the help you will see a list of more options: But you can go even further than that, pulling multiple dates at a time. For example, if I wanted all the closing prices since the start of the year I would enter the following formula:
In Google Sheets it automatically creates a table of values for you and you don’t have to worry about making an array like you would in Excel. The result of the above formula looks like this:
I only entered the formula in cell A1 and it produced the list of results. You can also select an interval if you don’t want every day in the range to show a total.
Getting News Feeds Using RSS
Another unique function of Google Sheets is you can pull news feeds from your favorite news site using the IMPORTFEED function. The key thing is you need to find the rss feed of the news site you want. Finding this is as easy as typing the name of the news feed you want and rss after it. For example, the the list of all of CBC’s rss feeds are found on http://www.cbc.ca/rss/index.html. I can use the top stories rss feed of http://rss.cbc.ca/lineup/topstories.xml for my feed. My formula in looks as follows:
By using “items title” it will only pull the title of the story, which is a bit neater and easier to look at as the titles do not take up as much space as the descriptions as well. If I selected “items” then I would get five columns of data – title, author, link, date, and the description. Instead, what I can do is in the next column over enter the same formula and select “items url” which will now have the story and the related link next to each other. This way I can pick and choose what I want. This is how it would look:
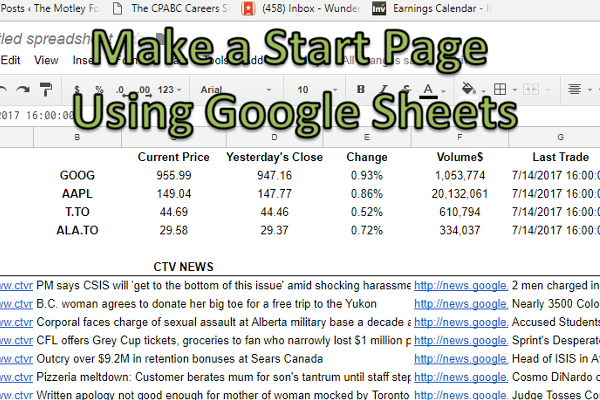
I have shrunk down column A since I didn’t want the whole url to show. I now have all the pieces to make a start page using nothing more than a spreadsheet:
Perhaps it doesn’t rival MSN or Google’s home page but it works for me. I’ve made the formulas for the stock calculations relevant to the cells in column B so I can change the ticker symbol as I want to. The main benefit with using this is 1) you don’t need to open a browser to get stock quotes or news, and 2) you can easily access this information from your phone, all you need is the Google Sheets app installed.
But wait, that’s not all!
Translating Text
I’m not sure why Google felt the need to, but you can even use their translator function as well inside of Google Sheets using the GOOGLETRANSLATE function.
What I could do is translate these news articles. You need to know the two character code for the language, to get that you can find it on this website:
So what I am going to do is translate the news headlines I pulled earlier and translate them into Chinese. Google has two language codes for Chinese – Simplified, and Traditional. I’ll go with simplified, which is zh-CN. My formula looks like this:
=GOOGLETRANSLATE(B1,”en”,”zh-CN”)
My output looks like this:
So now you can pull news stories from your favorite news site (just figure out the rss link) and you can translate it into whatever language you want. Unfortunately I can’t tell the accuracy of the translation, ‘Simplified’ Chinese didn’t make it any simpler for me. I still can only make out CSIS from all of that translated text.