HowtoExcel.net
cropped-h2e100x100.png

HowtoExcel.net

Analytics. Automation. Process Improvement.

  • Home
  • Blog
  • Templates
  • Tools & Calculators
    • Average Down Calculator
    • Compounded Annual Growth Rate Calculator
    • Inflation Calculator
    • Investment Growth Calculator
    • Live T-Account Template
    • Minimum Payment Calculator
    • Money Spent Calculator
    • Mortgage Payment Calculator
    • Mortgage Payment Calculator — Interest Rate Sensitivity
    • Mortgage Payment Sensitivity Calculator
    • Price-to-Earnings P/E Calculator
    • Stock Average Calculator
    • Time Spent Calculator
  • Shop
  • Cart
  • Contact Me

sddefault (1)

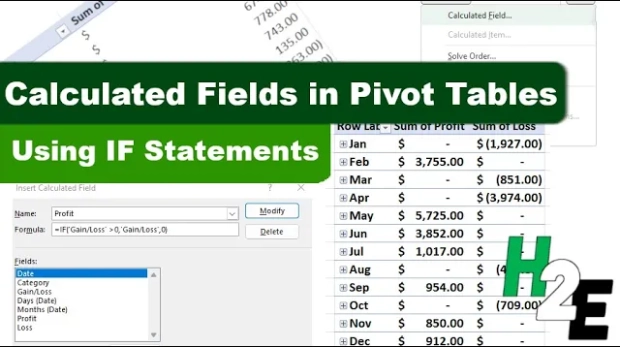
How to Add IF Statements to a Pivot Table

September 3, 2024
by howtoexcel pivot table

Pivot tables are a powerful feature in Excel that allow users to summarize, analyze, and visualize data. One of the more advanced features of pivot tables is the ability to add calculated fields. Calculated fields enable you to perform calculations ...

Read More
Income and Expenses Chart

How to Track Income and Expense in a Single Chart

August 27, 2024
by howtoexcel budgetscharts

Do you want to create a budget which tracks income and expenses on just one chart? There's an easy way you can combine them where you can show positive and negative values in a single column. Suppose we have the following income and expenses over a ...

Read More
sddefault

How to Break Ties in Excel and Rank with Multiple Criteria

August 20, 2024
by howtoexcel ranks

If you're tracking standings in Excel, you know it can be challenging to ensure that you have your rankings setup correctly, especially when factoring in multiple criteria. Ranking values based on a single column or field isn't complex, but when you ...

Read More
sddefault

How to Add a Calculated Column in Power Query

August 13, 2024
by howtoexcel power query

Power Query can help you summarize and analyze your data. But did you know that you can also add calculated columns similar to how you might in a pivot table? In this post, I'm going to show you how you can compare your values against an average to ...

Read More
hideblanks

Hide Blanks and Error Values on a Pivot Table

August 6, 2024
by howtoexcel formattingpivot table

Do you want a quick way to clean up your pivot table and remove blanks and errors from it? Below, I'll show you how to do that with just a few steps. In the below pivot table, I have error values and blank row values, which indicate that data is mis ...

Read More
pivottablevlookup

How to Use VLOOKUP with Pivot Tables

July 30, 2024
by howtoexcel pivot tablevlookup

Do you want to be able to use a VLOOKUP with a pivot table? While there isn't a way to natively do so, there is a way you can make it look as though your pivot table has a lookup function within there, and make it so that it expands along with your ...

Read More
GetRidofWarning6

How to Get Rid of the Red Warning Bar in Microsoft Excel

July 22, 2024
by howtoexcel errorsmacrosvba

Have you opened a file in Excel which contains macros in it only to find that you can't use it, because the content is blocked? If you've come across the following warning bar, I'm going to show you how can you remove it once and for all. Thi ...

Read More
sddefault

Converting Time Zones in Excel and Google Sheets

July 8, 2024
by howtoexcel time

If you work on large teams and/or interact with people all over the world, you know it can be challenging trying to work with time zones. While they aren't difficult to understand, it's easy to make a mistake when trying to arrange a meeting, as one ...

Read More
heat map

Create a Heat Map in Google Sheets

July 1, 2024
by howtoexcel chartsgoogle sheets

Heat maps are visual representations of data where individual values are represented by colors. They are particularly useful for identifying patterns, trends, and outliers in large data sets at a glance. By using a spectrum of colors, typically rang ...

Read More
value error

How to Fix #VALUE! Errors in Excel

June 25, 2024
by howtoexcel errors

Microsoft Excel is a powerful tool for data analysis and financial modeling, but encountering errors like #VALUE! can be a frustrating hurdle for many users. This error generally signals an issue with the way your formulas are set up or how data is ...

Read More
LOAD MORE
LOADING
cropped-h2e100x100.png

HowtoExcel.net

Analytics. Automation. Process Improvement.

© 2019 Company. All rights reserved.  Powered by  Phlox Theme

Shopping Basket

HowtoExcel.net

  • Home
  • Blog
  • Templates
  • Tools & Calculators
    • Average Down Calculator
    • Compounded Annual Growth Rate Calculator
    • Inflation Calculator
    • Investment Growth Calculator
    • Live T-Account Template
    • Minimum Payment Calculator
    • Money Spent Calculator
    • Mortgage Payment Calculator
    • Mortgage Payment Calculator — Interest Rate Sensitivity
    • Mortgage Payment Sensitivity Calculator
    • Price-to-Earnings P/E Calculator
    • Stock Average Calculator
    • Time Spent Calculator
  • Shop
  • Cart
  • Contact Me