BollingerBands

How to Create and Chart Bollinger Bands in Google Sheets and Excel

What are Bollinger Bands?

Bollinger Bands are used in technical analysis to help calculate and measure volatility. There are three bands that are included in chart: a moving average, and a lower and upper band. Normally, the upper and lower band are set to be within two standard deviations of the moving average. The standard deviation helps measure volatility and determines the width of the bands. As volatility increases, the band widens, and the opposite happens when volatility decreases.

The Bollinger Bands are often used by traders to identify opportunities for when to buy or sell a stock. If a stock price gets closer to the upper band, then it is considered to be overbought, and hence, this can be a time to sell. If, on the other hand, it is approaching the lower band, then it is oversold, and it may be an opportune time to buy. A similar tool that traders may also use is the Relative Strength Index, as that too tracks momentum and helps traders identify when a stock is overbought and oversold.

Why should you use Bollinger Bands?

Traders may use Bollinger Bands for a variety of reasons:

  • To identify buying and selling opportunities, such as when a stock is overbought or oversold. However, it’s important not to be overly reliant on a single indicator and it’s a good idea to also review other tools in conducting technical analysis to help confirm your trading decision.

  • Bollinger Bands can help gauge volatility. When the volatility is high, there is an opportunity for traders to take advantage of a large spread. With a large spread, there are more opportunities to buy low and sell high than there are when volatility is low and price is trading within just a narrow range.

  • Traders may also use Bollinger Bands to spot trends in the market as the bands will slope in a similar direction to price. This can help potentially identify buying and selling opportunities based on the stock’s trajectory.

How to create and chart Bollinger Bands

The process for creating a chart to show Bollinger Bands in Excel and Google Sheets is similar — the main difference is in how to pull in the stock price. The steps below go over the steps specific to Google Sheets:

  • Start with downloading the stock prices. In my example, I have downloaded the stock price for Meta Platforms going back to 2020. This was done using the GOOGLEFINANCE function in Google Sheets, and the formula is as follows: =GOOGLEFINANCE(“meta”,”price”,”1/1/2020″,today())

  • Calculate the 20-day moving average from the closing prices. This is done using the AVERAGE function. Assuming the closing prices start from cell B4, the formula would be as follows: =AVERAGE(B4:B23). Copy the formula down to all the cells.

  • Calculate the standard deviation using the STDEV function. This is also based on the last 20 closing prices and is copied down to the bottom of the data set. This is the formula to calculate the standard deviation based on this example: =STDEV(B4:B23).

  • Calculate the Upper Band. Do this by multiplying the standard deviation by 2, and adding that to the 20-day moving average. Assuming the 20-day moving average is in cell C23 and the standard deviation is in cell D23, this is what the formula would look like: =C23+D23*2

  • Calculate the Lower Band. For this, multiply the standard deviation by -2, and add that to the 20-day moving average. Based on the above assumptions, the formula would be as follows: =C23+D23*-2

Once all those formulas are entered, your data set should look something like this:

Google Sheets data showing stock prices, and upper and lower bounds for the Bollinger Bands chart.

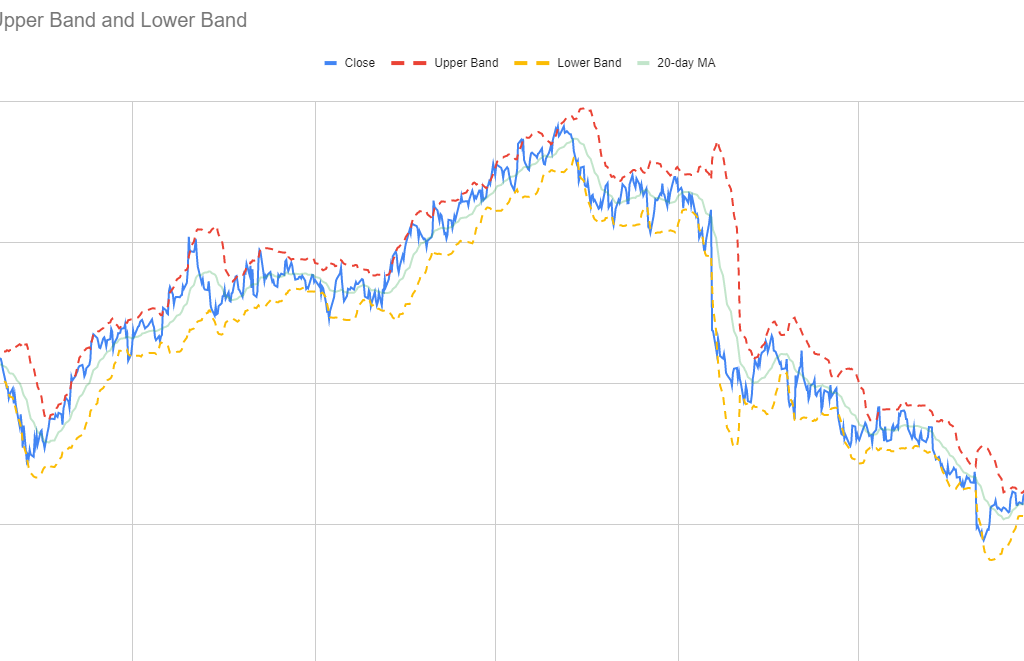
Next, create a line chart to show the values on a graph. Then apply any formatting (e.g. dotted lines, colors, etc) and you should have a visual that looks like this:

Chart showing Bollinger Bands in Google Sheets.

If you liked this post on How to Create and Chart Bollinger Bands in Google Sheets and Excel, please give this site a like on Facebook and also be sure to check out some of the many templates that we have available for download. You can also follow us on Twitter and YouTube.

PE Multiples

How to Calculate Trailing P/E and Forward P/E Multiples in Excel

If you’re looking to buy stocks, a one of the more common ratios you’ll likely consider in your analysis is the price-to-earnings, or P/E multiple. You can look at either the trailing P/E or the forward P/E. Below, I’ll look at what the difference between those multiples is, how to calculate each one, and how you can use them to determine a company’s expected growth rate.

What is the difference between the trailing P/E and the forward P/E?

The P/E ratio looks at the stock price in relation to earnings per share. If it’s a trailing earnings multiple, then that means you’re looking at the company’s earnings over the trailing twelve months, or ttm. A forward earnings multiple is based on analyst expectations and what the company’s earnings will be over the next year.

If a company had a worse year than normal or analysts are expecting lots of growth in the year ahead, the forward P/E will be lower than the trailing P/E. If, on the other hand, the company performed exceptionally well and perhaps benefitted from one-time gains, then its trailing P/E may look better (i.e. lower) than its forward P/E if analysts don’t expect a significant change in the business over the next year.

The smaller the gap between the trailing P/E and the forward P/E, the more consistent the earnings numbers are and the less of a change analysts are expecting from the previous year. If, however, the gap is significant, that could be an opportunity for investors because if a stock has a high trailing P/E multiple (due to an abnormally bad year), it can be missed on stock screeners if people are searching for stocks with low P/E multiples.

You can think of a forward P/E as what the company’s earnings will be in a normal or typical year whereas the trailing P/E is one that may have been distorted for a number of reasons.

How to calculate the trailing and forward P/E ratios

Here are the steps you can take to calculate the trailing P/E multiple:

  1. Add the company’s net income over the past four quarters. This is its income over the trailing twelve months.
  2. Take that total and divide it by the averaged diluted shares outstanding over the course of the year. Unless there’s a significant variation over the course of the past year, you can often just use the shares outstanding as of the most recent quarter. The result of this calculation will give you diluted earnings per share, or EPS.
  3. Get the current share price and divide it by EPS. This will be your trailing P/E multiple.

Here’s how I did the above calculations for Tesla’s stock in Excel, based on data as of Jan. 16, 2023 that was pulled from Yahoo Finance:

Trailing price-to-earnings calculation in Excel using Tesla as an example.

For the forward P/E multiple, the calculation is more straightforward since it is based on analyst expectations. Here are the steps to calculated the forward P/E multiple:

  1. Obtain the average analyst earnings per share estimate for the next year.
  2. Take the current share price and divide it by that estimate.

If you go to Yahoo Finance and go under the Analysis tab, you will see a series of analyst expectations for earnings for the new year:

Earnings estimates for Tesla's stock price as of Jan. 16, 2023.

Since I’m looking for the full year, I’ll take the average estimate for ‘Next Year (2023)’ which is an EPS of $4.79. By taking the share price of $122.40 and dividing by this figure, I arrive at a forward P/E of 25.55. This tells me that analysts are expecting Tesla to have a better year in 2023 as its forecasted EPS of $4.79 is higher than the $3.23 it has reported over the past four quarters.

You can use earnings multiples to estimate the earnings growth analysts are forecasting

This year, analysts are projecting that the company’s EPS will be $4.79, which is 48% higher than the $3.23 it reported over the past four quarters. However, you can estimate how much growth analysts are expecting from the business without having to dive into the EPS numbers.

Since the numerator, price, in the P/E multiples remains constant, the only change is the earnings, the denominator. You can do the same earnings growth calculation by taking the trailing P/E and dividing it by the forward P/E, and then subtracting 1 from that value:

Estimating earnings growth using the trailing and forward price-to-earnings multiples.

If the forward P/E is lower than the trailing P/E, that tells you that analysts are expecting that the company’s earnings are expected to decline in the coming year.


If you liked this post on How to Calculate Trailing P/E vs Forward P/E in Excel, please give this site a like on Facebook and also be sure to check out some of the many templates that we have available for download. You can also follow us on Twitter and YouTube.

H2Eadjustedclosingprice

How to Calculate Yahoo Finance’s Adjusted Closing Price

If you’ve ever looked up historical stock prices on Yahoo Finance, you know that there is both a closing price and an adjusted closing price. Sometimes the values are the same, but sometimes there’s a difference In this post, I’ll cover why that happens, and how you can calculate the difference yourself.

What is the difference between the two prices?

The adjusted closing price in Yahoo Finance factors in the impact of dividend payments. For stocks that pay dividends, the further back you go, the greater the difference there will be between the close and the adjusted closing price. With the closing price, you’ll just see the raw change in price, whereas the adjusted closing price will also factor in the dividend, and that can give you a better view of how the stock’s total returns have been over time, not just from the increase in share price. And thus, the longer of a duration you’re looking at and the more dividend income along the way, that creates more of a gap between the close and adjusted close.

For stocks that don’t pay dividends, there will be no difference between these two values.

How to calculate the difference

A difference between the two prices in Apple’s stock history doesn’t show up until the last time it issued a dividend, on Nov. 4. Technically the company didn’t pay the dividend on that day, but that was the date of record for the dividend, and so investors who owned the stock at that date were eligible for the dividend. The actual payment took place later, on Nov. 10.

Apple stock's historical stock prices.

To factor in for this difference, we need to take the amount of the dividend ($0.23) and divide it by the stock’s price immediately before this date. On Nov. 3, the stock price closed at $138.88. Taking $0.23 and dividing it by the stock price returns a value of 0.001656. If we take 1 minus that amount, that equals 0.99834389. That’s what the closing price needs to be multiplied by to arrive at the adjusted close. Here’s how it looks in the spreadsheet:

Spreadsheet showing the calculation of adjusted closing price per Yahoo Finance.

That ‘dividend impact’ factor will be applied to every value before the dividend. And when doing that, you arrive at the adjusted closing price. However, that’s not the end of this because if we go to the next dividend in August, the values are off again:

Apple's adjusted closing price in August 2022.

The issue here is that we need to factor in another dividend payment. It’s another payment of $0.23 and this time the stock price was $165.81. The discount factor is now 0.99861287. However, this needs to be multiplied by the first discount factor as well, in order to ensure we are adjusting for both dividend payments. And so the correct factor is 0.996959:

Adjusted closing price calculations for Apple's stock.

You would need to continue to make these adjustments the further back in time you go, and each time, taking into account all the dividend payments in-between today and the date of the stock price on that day. This is why over time, the difference gets larger.


If you liked this post on How to Calculate Yahoo Finance’s Adjusted Closing Price, please give this site a like on Facebook and also be sure to check out some of the many templates that we have available for download. You can also follow us on Twitter and YouTube.

StockTradingTemplate

Free Stock Trading and Tracking Template in Excel

***UPDATE: There is a newer version of this template available here****

For a limited time, I have a free stock trading template that is available for you to download in Excel. If you buy and sell stocks often, this is a template that will help you easily enter in your trades and track your performance.

How to use the template

There are three main buttons on this template that you will need to use, all of which are located within the ribbon, under the Trading Journal group:

Ribbon buttons on the stock trading template.

The Enter Transaction button will allow you to post and trades you make. Clicking on it will show the following pop up:

Dialog box allowing a user to enter a transaction.

At the very top there is a Date Picker button which will allow you to select the date of the transaction, rather than manually entering it. Here is an overview of the other fields;

  • Ticker: this is simply the name of the stock you are buying.
  • Action: indicate whether you are buying, selling, or adding to an existing position.
  • Strategy: select your strategy for this transaction. If you want to add or remove available strategies, click on the Update Strategies button.
  • Shares this is the number of shares you are buying or selling.
  • Price: this is the price per share for the transaction.
  • Fees: the amount of any fees you have incurred on the transaction.

Once all this is entered, click on the button to Post Transaction and the details of the transaction will be posted to the Log sheet and an entry will be opened up on the Transactions tab. The Transactions tab will show you a summary of your positions, including any profits and losses, and whether they are open or closed.

There is a Settings tab where you can manually adjust strategies. You can also specify different holding categories should you want to track that (e.g. what constitutes a short, medium, or long holding period).

Once you’ve entered some transactions, you can head over to the Summary tab which will give you a visual breakdown of your investments. To be sure the data is updated correctly, click on the Refresh button in the ribbon button (not the default refresh option in Excel).

Stock template showing a summary of performance.

You can use slicers in the report to filter by different dates, strategies, and holding periods.

You can download the Stock Trading Template here.


If you like this Stock Trading and Tracking Template, please give this site a like on Facebook and also be sure to check out some of the many templates that we have available for download. You can also follow us on Twitter and YouTube.

Berkshire13f

Free Excel Template to Track Berkshire Hathaway’s Portfolio

Warren Buffett fans like to track the billionaire investor’s moves, and a good way to do that is through Berkshire Hathaway’s 13f filings. His company reports its holdings every quarter, showing where there were changes in its positions. By looking at multiple filings, investors can track the changes from one period to another. With this free template, you can do that quickly and easily all on your own. All you have to do is specify the specific filings that you want to compare to one another.

How the template works

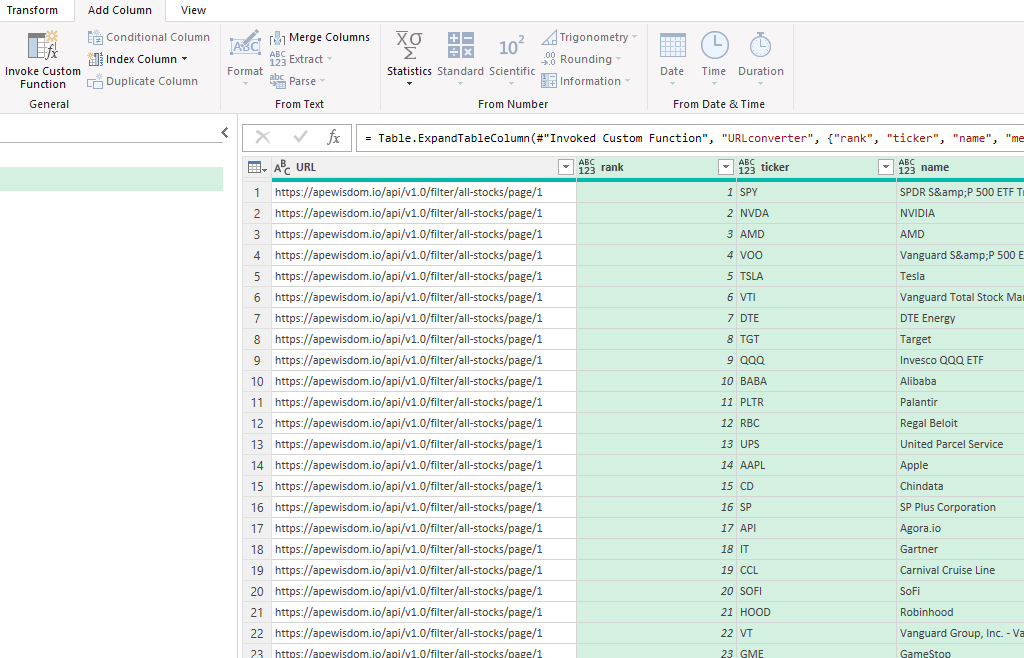
This template uses PowerQuery to grab the data from the 13f filings. It will then compare the two to find the changes in share count.

There are only two inputs you need for the template, both are on the Current.Holdings tab. You’ll need to paste the URL for the current 13f filing and the previous one (or whichever filings you want to compare against one another). It can sometimes be a bit tricky to get exactly what you’re after. Here’s how you can find the 13f filings for Berkshire Hathaway to use in this template:

  1. Click on the following link, which has company’s filings on the SEC website: https://www.sec.gov/edgar/browse/?CIK=1067983 (this link is included within the template).
  2. Click on the View filings button on the page.
  3. Do a search for 13f so that you can see just the 13f filings on that page:
Berkshire Hathaway's 13f filings on the SEC website.

4. Find the reporting period you want and click on the Filing button — don’t click on the actual description next to it.

5. When you open up the link, you should see multiple files you can open. Select the information table that is in html format:

Selecting the information table in HTML format from the SEC website.

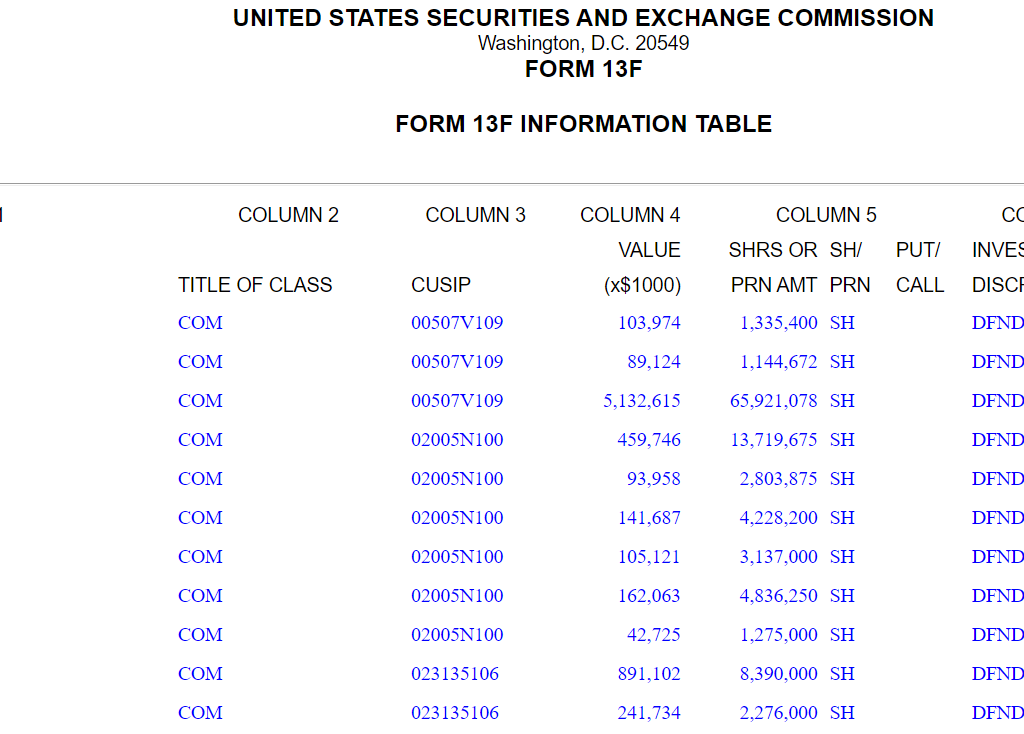
When you open the file, you should see the holdings in a table format:

13f filing for Berkshire Hathaway.

If this is what you see, then the link you’ve downloaded will work. Note, on older 13f filings (e.g. 2013 and older), the format is in a text file and they won’t work with this template.

6. Copy the link and enter it into one of the fields on this template, either for the new filing or the old one.

Entries for the old and new 13f filings.

7. Once you’ve filled in both the new and old links, then go to the Data tab in Excel and click on Refresh All. This will update the queries that the template relies on, and calculate the changes.

Now the different sheets will update:

  • Current.Holdings: this will show you the current holdings as per the New13f file
  • Change.In.Holdings: this will show you the change between the two filings. The change will be reflected in total shares and as a % of change in shares.
  • Old.Holdings: this will show the number of shares held per the Old13f file.
Summary of Berkshire Hathaway's holdings per their latest 13f filing.

Download the template

This template is completely free to use and you can download the Berkshire Hathaway 13f Template here.


If you like the Berkshire Hathaway 13f Template, please give this site a like on Facebook and also be sure to check out some of the many templates that we have available for download. You can also follow us on Twitter and YouTube.

MultipleTickers

Import Multiple Stock Tickers Into Excel Using Power Query

Power Query can allow you to easily import data from another spreadsheet. But did you know that you can load multiple files from a folder at once? All you need to do is load the files you want to import into a folder, and Power Query can do the rest. In this article, I’ll show you how you can do this with stock prices and how you can import multiple ticker files from Yahoo Finance into Power Query at once.

Put all the files into a single folder

Whatever type of files you want to import, the key thing is that their format is consistent. This is because Power Query will follow a similar process when importing them. If, for example, you always remove certain columns from a file, then you want to make sure that every file you import has those columns. If there’s a discrepancy, then Power Query may struggle to load the files properly.

In this example, I’m going to use CSV files from Yahoo Finance. Let’s say I want to download data for multiple stock tickers. If I go to Apple’s stock ticker page, there’s a link to download the latest stock prices. In a previous post, I went over how to download stock prices for a single ticker. This time around, I’ll show you how you can do it for as many as you want. If I want to download multiple tickers, I’ll start by downloading all the different CSV files for them and putting them into just a single folder:

Folder with CSV files for different stocks.

Here I’ve got multiple tickers downloaded, including Apple’s. This is now the folder I will reference when extracting the data from Power Query.

Importing the files Into Power Query

In Excel, the next step is to simply download the data. Under the Data tab, click on the Get Data button and select the option for From Folder:

Selecting to import files into Excel from a folder.

Then, navigate to the folder where your files are stored and click on Open. Now the Power Query window will load and you should see something like this:

Power Query window showing all the files in a specific folder.

Here I see all the files from my folder. There are three different options I can take at this point:

  • Transform Data. Clicking on this option will allow me to transform the table above.
  • Load. If I don’t want to make any transformations and just load the table above, this is what I’ll select. But like the above option, this will not combine the data, so this is not what I want.
  • Combine. This is the option that I will choose as it will combine all these files together. From here, you’ll have the option to Combine and Transform or to just Transform and Load (e.g. if you don’t need to make any adjustments).

On the next screen, you can click on OK and the combined data will be loaded. To make the process as seamless as possible, you’ll want to ensure that your files follow the same format. Otherwise, it can be more difficult to get the desired results.

After clicking on OK, now the data loads, and all my stock data from Yahoo Finance is downloaded, with all the different tickers:

Multiple stock files downloaded into Excel.

Now, you can add more downloads from Yahoo Finance for different tickers, put them in the same folder, and then just refresh the query. Your spreadsheet will now automatically update based on the CSV files within the folder.


If you liked this post on How to Import Multiple Stock Tickers Into Excel Using Power Query, please give this site a like on Facebook and also be sure to check out some of the many templates that we have available for download. You can also follow us on Twitter and YouTube.

H2ESecReport

How to Convert a Table From an SEC Report Into Excel

If you want to download a company’s financial statements or data, the easiest place is often straight from the source: the Securities & Exchange Commission (SEC). You can download financials in Excel format if there is an interactive option within the SEC filing, but that won’t give you all the tables contained in an earnings report. In this example, I’m going to use Adobe’s most recent earnings report to show you how to get a table into Excel

Downloading the data

Adobe’s earnings report is found here, with the following financials on page 4:

Adobe's income statement for the quarter ending March 4.

Copying it into Excel

Copy the table and then go to paste it data into Excel. But when you right-click in Excel, make sure to select the option to paste it so it matches the formatting on the sheet, as shown below:

Paste with a format matching the spreadsheet.

Now, the data pastes without any of the colors and formatting onto my Input sheet:

Adobe's earnings report downloaded into Excel.

If when you paste it doesn’t show up like this and it looks like just a few lines, re-try copying the data. It may help not to include the header that says “three months ended” and simply start copying from the first line item (“revenue” in the above example”) to ensure that Excel picks it up as a table.

Formatting the data

It looks pretty good except that I have many extra columns. And numbers that have dollar signs have been pushed out by one column. What I will do here is create a template in a separate sheet that will automatically pull in what is needed. The new tab, called Output, will be where I create my formulas. My assumption is that the spacing will be consistent and that the current period values are in columns D and E, and the ones from the prior-year period are in columns J and K.

Starting in cell A1, I’ll create a simple formula that checks if the same value on the other sheet is blank. If it isn’t, then it will pull in the value, otherwise, it will remain blank:

=IF(Input!A1="","",Input!A1)

I will do the same thing for column B, except this time I am looking at values from the Input tab in column D. And I will need to adjust for if there is a $ sign. If there is, I need to pull the value from column E instead. Here’s what that formula looks like:

=IF(Input!D1="","",IF(Input!D1="$",Input!E1,Input!D1))

That gets me a bit closer to where I want to get to:

Financial figures pulled into a separate tab with formatting applied.

There are still a couple of issues. The first is that on row 30, there is a symbol that isn’t a dash that I need to remove. This is character code #151. And there’s also a trailing blank space behind the numbers that needs to be removed. This isn’t your ordinary blank space and it is character code #160. I need a couple of SUBSTITUTE functions to remove those character codes:

=IF(Input!D1="","",SUBSTITUTE(SUBSTITUTE(IF(Input!D1="$",Input!E1,Input!D1),CHAR(160),""),CHAR(151),0))

For character 151, I want to replace this with a 0 value since that’s what the symbol is in place of. Next, I need to convert these values to numbers. I can do this by multiplying them by a factor of 1. I’m going to use the IFERROR function as well so that in case it’s text, it will return the original value in column D. Here’s my completed formula:

=IF(Input!D1="","",IFERROR(1*SUBSTITUTE(SUBSTITUTE(IF(Input!D1="$",Input!E1,Input!D1),CHAR(160),""),CHAR(151),0),Input!D1))

Now, I can repeat this formula in the adjacent column. Except this time instead of referencing D and E, I’ll refer to columns J and K. Now, my output tab looks as follows, after applying some formatting to it:

Financial statement formatted in Excel.

This can be re-used over for other tables in an SEC report, as they generally follow the same pattern. For example, this is Adobe’s table showing sales by segment:

Adobe's sales broken out by segment.

By dropping this into my Input tab, this is what my Output now shows:

Output tab in Excel showing Adobe's segmented financial information.

All that I needed to do was to copy the formulas and just adjust the columns they referenced on the Input tab. If you’d like to use the file I’ve created for your own use, you can download it for free, from here.


If you liked this post on How to Convert a Table From an SEC Report Into Excel, please give this site a like on Facebook and also be sure to check out some of the many templates that we have available for download. You can also follow us on Twitter and YouTube.

H2ESP500

Here’s How the S&P 500 Has Historically Performed After a Bad January

The stock market is off to a rough start to 2022, with the S&P 500 falling more than 5% in just one month. Using a spreadsheet, we can analyze historical trends and patterns to identify what normally happens after such bad starts. Below, I’ll use data from Google Sheets to pull in historical values and analyze how the index has performed afterward and whether this year is doomed to be a bad year, or if a recovery is likely and if now is a good time to invest in stocks.

Start with downloading the historical data

The first step is to get the S&P 500’s historical values in Google Sheets. This can be done using the GOOGLEFINANCE function. Using the .INX symbol, I can calculate the S&P 500 values going back to the 70s. Here’s a matrix showing the returns over the past 50 years, after applying some conditional formatting to the values:

Historical S&P 500 values in Google Sheets.

Filtering the data

To zero on in just the largest January declines, I can use the Filter by condition option to specify January values where the percent change is less than negative 5%:

Filtering data in Google Sheets.

That leaves me with the years when the S&P 500 dropped by 5% or more in the first month:

Now that I have a list of the years I’m looking to analyze, I can start creating some charts.

Using charts to summarize the performances

The first visual I’m going to create will look at how the index has performed after January, after those bad starts. To do that, I need to take the year-end values and divide them by the values at the end of January. This tells me how much the index rose or declined in the remaining months. And when grouping those variances, this is what the data shows:

S&P 500 returns after January in years where it declined by more than 5% in the first month.

Of the 7 previous times when the S&P 500 dropped 5% in January, 3 times it would continue to drop in the following months and finish even lower. Only two times would the index rise by more than 10%. I can also average the results, comparing the down years versus the overall average:

Average S&P 500 returns versus those returns in down years.

This tells me that in a year where the S&P 500 typically tanks in the first month, the overall returns from the index are likely to be negative. However, to add a bit more context to this, I’ll look at the individual returns by year and compare them against the 50-year average, which is summarized in this table:

Table showing the S&P 500 returns in years after a bad January versus the overall 50-year average.

By keeping the average column constant, it creates a straight line for the chart and makes it easy to visualize the individual years’ returns and how they compare against it:

S&P 500 annual returns in years where the index dropped by 5% in January versus the 50-year average.

A few of the things that stand out from the data is that in three of the years (2000, 2008, 2009), the markets were either in the midst of a significant crash or recovering from it. It helps put into context some of these returns, suggesting that the other years might indicate more typical returns in a non-crash year. And if that’s the case, investors may expect fairly modest returns this year, possibly negative ones overall. Although it isn’t a large data set, it certainly suggests that the stock market may be facing a down year in 2022.

You can check my calculations in the Google Sheets file I used to create this data.


If you liked this post on the S&P 500’s Historical Returns, please give this site a like on Facebook and also be sure to check out some of the many templates that we have available for download. You can also follow us on Twitter and YouTube.

H2EHistoricalMonthlyReturns

Historical Stock Returns by Month

Have you ever wondered how a stock has typically performed month over month? Using a spreadsheet, you can calculate monthly returns and identify patterns of which months are traditionally strong for a stock, and which ones aren’t. In this example, I’m going to use Google Sheets to pull in stock prices and calculate historical stock returns by month.

Start with pulling in historical stock prices

To get started, I’ll need to extract a stock’s price history. This can be done using Google Sheets’ GOOGLEFINANCE function. The key is in setting a start date that goes far enough back to ensure you get enough historical data to use in your calculations. A good function to use within that is the TODAY() function which ensures you will always be counting backward from today’s date and don’t need to hardcode a date. If I want to go back to 2008, for example, I can set my formula to deduct about 5,000 days.

To pull Amazon’s stock price going back that far, this is what my formula would look like in Google Sheets:

=GOOGLEFINANCE("AMZN","price",TODAY()-5000,TODAY())

Now I have the following values:

Amazon's historical stock price in Google Sheets.

The one problem here is that the date values contain the time, 16:00:00, which represents the 4 pm closing time of the stock market. I only want the actual date since I’m going to be doing a lookup and don’t want to include time. To extract just the date, I can use the DATE() function and use the YEAR(), MONTH() and DAY() functions to refer back to the values in column A. For example:

=DATE(YEAR(A2),MONTH(A2),DAY(A2))

The above formula would give me the date in column A without the time. I’ll add an IF statement at the start so that in case the value in column A is blank, my formula simply won’t compute anything:

=if(A2="","",DATE(YEAR(A2),MONTH(A2),DAY(A2)))

Now I have a table that has just date values without any time:

Google Sheets table with dates showing no time next to share price.

Creating a date matrix

Next, what I’m going to do is create a matrix that has years going vertically and months going across:

A matrix in Google Sheets with months going across and years going down vertically.

I’m going to fill in these values with the stock’s returns in each of those months. The key to making this work is by using the DATEVALUE() function which allows me to enter a date. For example, if I entered the following formula:

=DATEVALUE("Jan 1, 2022")

It would result in the following output:

1/1/2022

In the first cell of my matrix, for the JAN 2021, I’ll combine the month abbreviation (JAN) with the year (2021) and the first day (1). Here’s how that would work if the month name is in cell F1 and the year is in E2:

=DATEVALUE(F$1&" 1, "&$E2)

However, let’s assume I don’t want to pull the first day of the month and instead want to pull the ending month’s value. For that, I can use the EOMONTH() function. And then I would enclose the current formula within that:

=EOMONTH(DATEVALUE(F$1&" 1, "&$E2),0)

The 0 value at the end indicates how many months I want to jump by. And since I just want the end of the current month, I don’t need to jump by any months, which is why I set it to 0. At this point, I have a date, and now I can use this inside of a MATCH() function to find the row that matches this date. Assuming the date values in are column C, here is the formula:

=MATCH(EOMONTH(DATEVALUE(F$1&" 1, "&$E2),0),$C:$C,1)

And lastly, inside of an INDEX function that will return the corresponding price from column B:

=INDEX($B:$B,MATCH(EOMONTH(DATEVALUE(F$1&" 1, "&$E2),0),$C:$C,1),1)

Now the formula will pull in the price for a given month. But if I want the month-over-month return, I need to take the month-end price and divide it by the previous month’s ending value. To get the previous month’s price, I use the same formula except instead of a 0, I’ll enter -1 for the number of months:

=INDEX($B:$B,MATCH(EOMONTH(DATEVALUE(F$1&" 1, "&$E2),-1),$C:$C,1),1)

I’ll combine the two formulas now, taking the current month-end price and dividing it by the previous month’s value and also deduct -1 at the end to adjust for it being a percent-change calculation:

=INDEX($B:$B,MATCH(EOMONTH(DATEVALUE(F$1&" 1, "&$E2),0),$C:$C,1),1)/INDEX($B:$B,MATCH(EOMONTH(DATEVALUE(F$1&" 1, "&$E2),-1),$C:$C,1),1)-1

Now, copying this formula across the entire matrix, I can see the stock’s historical returns by month. I’ve added some conditional formatting to contrast the good months from the bad ones:

Matrix showing monthly returns while also utilizing conditional formatting.

Besides relying on colors, I can also add a win rate % where I can count the times where the return was more than 0% (i.e. a ‘win’) and divide this by the total number of values. In column F, for January, the formula looks like this:

=COUNTIF(F2:F12,">0")/COUNTA(F2:F12)

I’ll also average the returns so that it’s easier to see the best and worst-performing months:

Matrix showing monthly returns, summarized by win rates and averages.

Judging from this, April looks to be the best time to own Amazon’s stock. It normally returns a positive return and its average over the past 11 years has been a gain of just under 8.5%. To re-create this analysis for other stocks, simply change the ticker symbol.


If you liked this post on How to Calculate Historical Stock Returns by Month, please give this site a like on Facebook and also be sure to check out some of the many templates that we have available for download. You can also follow us on Twitter and YouTube.

H2EMACDLine

How to Create a MACD Chart

The MACD line and chart is a popular tool for technical analysts who buy and sell stocks. And in this post, I’ll show you how you can create it from start to finish. In my example, I’ve downloaded Apple’s stock price history for the past year from Yahoo Finance, and I’ll use that to calculate its MACD line. Here’s a sample of what I’m starting with:

Apple's stock price history.

Calculating the exponential moving averages

To calculate the MACD line, I’ll need to create multiple exponential moving averages (EMAs). One for 9 days, 12 days, and for 26 days. The logic will be the same so I can start with creating a formula for the 9-day EMA and then apply that to the others.

I’m going to create a couple of variables. The first being the n for the number of days. And the second one is for the weighting that you’ll apply to more recent values, and thus, turning it from a simple moving average into an exponential one. The weighting is calculated as follows:

=2/(1+n)

I’ll start my formulas to calculate the 9-day EMA by first checking to see if I have at least 10 data points. If I don’t, then I’m only calculating a simple moving average. Here’s how the start of that formula looks, assuming my closing stock prices start from cell B5 and my variable n is in cell C1:

IF(COUNTA($B$5:$B5)<=C$1,AVERAGE($B$5:$B5)

A key part of the formula is freezing cells properly. Cell $B$5 won’t move, but $B5 will as I drag it down. And this allows me to calculate the cumulative number of data points, and the corresponding average. The next part of the formula is what happens if I have more than nine data points. In that case, I will take the weighting (this is cell C2) on my sheet, and multiply that by the difference between the most recent stock price and the previous EMA. This will then get added to the previous day’s EMA:

C$2*($B5-$C4)+$C4

Column C is the one that contains the EMAs. My complete formula is as follows:

=IF(COUNTA($B$5:$B5)<=C$1,AVERAGE($B$5:$B5),C$2*($B5-$C4)+$C4)

I can now copy this logic across multiple columns to calculate the 12 and 26 day EMAs as well:

Multiple exponential moving averages calculated in Excel.

Now, I’ll set up the calculations for the final three columns:

  • MACD: This involves taking the 12-day EMA and subtracting the 26-day EMA from that.
  • Signal Line: This is a 9-day EMA of the MACD line.
  • Histogram: This is calculated as the difference between the MACD line and the Signal line.

With all those columns set up, here is my completed table:

Excel spreadsheet showing MACD calculations.

Creating the charts

With all the columns set up, the next part is to put the key data into a chart to illustrate the MACD line, Signal line, and Histogram. To make the chart look like a typical MACD chart, I’ll need to set the MACD line and Signal line to be line charts, and for the Histogram to be a column chart.

Initially, when the chart is created, there’s too much data in there since the data set is bigger than it needs to be:

Chart showing all MACD calculation columns.

To fix this, I right-click on the chart and click Select Data. Then, I remove all the series except for the last three: MACD line, Signal line, and Histogram. My updated chart looks as follows:

Excel chart showing the MACD line, Signal line, and Histogram.

There are still a few more changes that I am going to make here. The first is to fix the axis, as there are gaps between the column charts. That’s because Excel is recognizing the axis as a date axis. And while that’s correct, that means there will be gaps since stocks don’t trade every day of the week, and thus, those gaps, are weekends. To fix this, right-click on the axis and click Format Axis. And then, change the Axis Type so that it is a Text axis:

Changing the axis type in Excel.

And then, under the Labels section, I set the position so that it is Low and at the bottom of the chart. My updated chart looks a bit better:

MACD chart in Excel.

The last change you may want to consider is adjusting the column chart gap, to shrink it so the chart looks more like a histogram. If you right-click on them and click Format Data Series, there’s an option to change the Gap Width. I find that setting this to 50% normally results in a good gap size::

MACD chart in Excel after making changes to the columns.

And now we’ve got a chart that resembles what you might find on major finance sites when looking at MACD. If you want to follow along with the sheet that I’ve created, you can download my MACD chart template here.


If you liked this post on How to Create a MACD Chart, please give this site a like on Facebook and also be sure to check out some of the many templates that we have available for download. You can also follow us on Twitter and YouTube.