Excel’s Power Query is a powerful data transformation and analysis tool that allows users to retrieve, clean, and shape data from various sources. While Power Query provides an extensive set of built-in functions, there may be scenarios where you need to perform custom operations on your data. This is where custom functions in Power Query come into play. In this article, I will go over how to create a custom function in Power Query that you can invoke and re-use.
Steps to creating a custom function in Power Query
Creating custom functions in Power Query involves using the M language, which is the scripting language underlying Power Query. It can be complicated to create but I’ll show you two ways you can create a function. The first method is directly through coding, the other is after converting a query into a function.
In this example, I’m going to pull all the stocks that are contained from a list of exchange-traded funds (ETFs). I’ve created the following table for this purpose, called tblETF:
Creating a custom function from scratch
If you’re creating a function in Power Query directly from code, here’s how to do that:
1. Go to load the data into Power Query by selecting a cell in your table, then click on the Data tab and click From Table/Range.
2. That will open up Power Query. Once there, on the Home Tab, click on the Advanced Editor button:
3. Create a name for the function using the let variable. In this example, I’m going to call it getholdings and it will pull all the holdings from the etf field. The opening line of the code is as follows:
let getholdings = (etf) =>
4. Next, list the commands that the function should execute. I’m going to pull the data from the stockanalysis.com page relating to the etf. This requires using the Web.Contents function and modifying the URL so that it includes the etf symbol:
5. Now that the function is created, go into the query for the list of ETFs. Create an additional column from the Add Column tab, and select the button to Invoke Custom Function.
6. Set a column name for the new column. Then, specify the function query to reference. And you’ll also need to specify where the ETF value is coming from, which involves selecting the column:
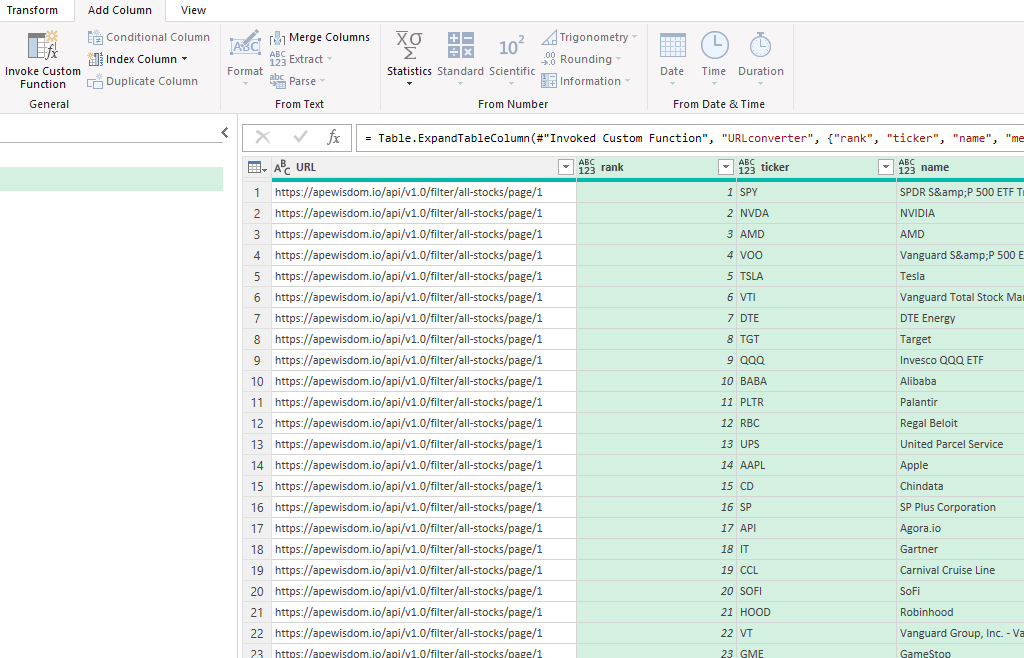
7. Next, you’ll expand the table that has been created within the column. This is done by pressing on the icon that shows arrows going in opposite directions. Then, select all the available columns.
You should end up with something that looks like this:
You can now click Close & Load and this data will load in your Excel spreadsheet. Now you can add to your ETF list and refresh the data, and the table of all the holdings will populate.
Converting a query into a function
If you’re not comfortable coding with Power Query, you can first create the steps, and then convert the query to a function.
First, it’s necessary to create the query. In the previous example, I loaded the URL from a dynamic web page. To do that, I’ll start with selecting the From Web button on the Get & Transform Data section:
Next, populate the entire link, without the ETF variable — this will be added later:
Then, select the table that contains the data and click the LoadTo button and select connection only:
Then, right-click on the query to edit it so that you’re back in Power Query. From there, click on the Advanced Editor and you should see this:
This is similar to the code in the first approach. To convert this into a function, we need to add another let variable and specify the function name, and any variables that will be used in the function. For the first line, I’ll add the following
let getholdings = (etf) =>
and for the URL, I’ll put the etf variable into there:
Here’s the updated code, with the changes highlighted in yellow:
Now I’ve converted my query into a function that can be invoked.
If you liked this post on How to Create a Custom Function in Power Query, please give this site a like on Facebook and also be sure to check out some of the many templates that we have available for download. You can also follow me on Twitter and YouTube. Also, please consider buying me a coffee if you find my website helpful and would like to support it.
Power Query is a powerful data transformation tool in Excel that allows you to effortlessly connect to various data sources, cleanse and manipulate data, and unlock advanced functionalities such as fuzzy matching. By leveraging the inherent “Fuzzy Lookup” feature within Power Query, you can seamlessly compare and match similar values across columns or tables using intelligent fuzzy logic algorithms. This article will highlight how you can use this functionality to help consolidate data, improve accuracy, and correct mistakes.
What is the purpose of a fuzzy lookup in Power Query?
A fuzzy lookup in Power Query refers to a powerful feature that allows you to match similar or related records within your dataset, even if they contain variations or discrepancies. Unlike an exact match that demands identical values, a fuzzy lookup takes into account the degree of similarity between values using intelligent fuzzy logic algorithms.
Imagine you have a dataset containing customer names, and you want to compare it with another dataset to identify potential matches. However, due to typos, misspellings, or differences in formatting, the exact matches may not yield the desired results. This is where a fuzzy lookup comes to the rescue.
By using a fuzzy lookup, you can overcome these obstacles. Power Query evaluates the similarity between values based on factors such as spelling variations, phonetic similarities, transpositions, and even differences in word order. This flexible approach allows you to find connections between records that might have otherwise been missed and unmatched.
There are many benefits of fuzzy lookups. They enhance data accuracy and integrity by enabling you to identify related records that might have been entered inconsistently. They can consolidate information from different sources, harmonize data formats, and facilitate a comprehensive analysis of your datasets.
Fuzzy lookups are particularly valuable when dealing with large datasets, data integration, data cleansing, or any scenario where data inconsistencies are prevalent. They provide a robust mechanism to uncover hidden associations that might have otherwise resulted in incomplete data. Leveraging the power of fuzzy lookups in Power Query can significantly improve the quality of your data analysis.
What is the difference between an exact match and a fuzzy match?
An exact match refers to a comparison between values that must be identical in every aspect, including spelling, punctuation, and formatting. It requires an exact one-to-one correspondence between the compared values.
A fuzzy lookup, however, takes a more flexible approach by considering variations, similarities, and patterns within the values being compared. It utilizes fuzzy logic algorithms to calculate the degree of similarity between the values, allowing for differences in spelling, formatting, and other factors. Here’s an example:
In this example, an exact match would fail to identify a match due to the slight difference in spelling (“Johhnson” instead of “Johnson”). However, a fuzzy lookup would recognize the similarity between the values based on the fuzzy logic algorithms, identifying them as a potential match.
While an exact match demands complete identity, a fuzzy lookup offers a more lenient approach by accommodating variations, spelling differences, abbreviations, and even phonetic similarities. It enables the discovery of relationships and connections that might otherwise be missed, allowing for more comprehensive data analysis and data integration.
The limitations of a fuzzy lookup
While fuzzy lookups in Power Query offer a powerful mechanism for matching similar records, it is important to be aware of their limitations. Understanding these limitations can help you effectively address challenges and make informed decisions when utilizing fuzzy lookups in Power Query.
Performance Impact: Performing fuzzy lookups on large datasets can have an impact on performance. Fuzzy matching involves complex algorithms that analyze the similarity between values, which requires additional computational resources. When working with extensive datasets, it is advisable to consider the potential performance implications and evaluate whether optimization techniques, such as limiting the scope of matching or using more specific matching criteria, are necessary.
Configuring Fuzzy Matching Parameters: The success of a fuzzy lookup heavily relies on properly configuring the fuzzy matching parameters. Selecting the appropriate similarity threshold and adjusting other options, such as case sensitivity or accents, is crucial. However, finding the right balance can be challenging, as overly strict or lenient parameters may result in missed matches or false positives. It often requires experimentation and fine-tuning to achieve the desired level of matching accuracy.
Data Quality and Variations: Fuzzy lookups are highly dependent on the quality and consistency of the data being matched. Inaccurate or inconsistent data, such as misspellings, abbreviations, or incomplete information, can impact the effectiveness of fuzzy matching. While fuzzy lookups can handle some degree of variation, extreme discrepancies or inconsistent patterns in the data may hinder accurate matching.
Ambiguity and Multiple Matches: In certain cases, fuzzy lookups may encounter situations where multiple records match a single value, leading to ambiguity. This can occur when there are similar records or when the matching criteria are not precise enough. Dealing with such scenarios requires additional consideration and possibly manual intervention to determine the correct matches.
Sensitivity to Dataset Size and Complexity: The effectiveness of fuzzy lookups can vary depending on the size and complexity of the dataset. Extremely large datasets or datasets with high variability in the values being matched can pose challenges. It is important to assess the scale and complexity of the data and consider alternative approaches, such as data preprocessing or dividing the task into smaller subsets, to manage the impact on performance and improve matching accuracy.
While fuzzy lookups provide valuable capabilities for identifying similar records, it is essential to be mindful of these limitations. There can be a risk of relying too heavily on fuzzy matches which results in erroneous results. By understanding and addressing these limitations appropriately, you can maximize the benefits of fuzzy lookups in Power Query and make informed decisions when incorporating them into your data analysis workflow.
Steps to do a fuzzy lookup in Power Query
Here’s a detailed overview of how to perform a fuzzy lookup in Excel:
Step 1: Load your datasets into Power Query. Open Excel and go to the Data tab. Click on “Get Data” and select the appropriate option to load your datasets into Power Query. This could be from a file, a database, or any other supported data source. In this example, I have a couple of tables. One for the data entry, that contains misspellings. And another for the available values that users should have entered:
Step 2: On the data-entry table, select the Home tab and click on Merge Queries.
Step 3: Select the other table and highlight the fields to merge. Leave the default join as a Left Outer and below it, select the option to Use fuzzy matching to perform the merge. Upon doing this, you should see Power Query indicate that it has found more matches.
You can also open up the fuzzy matching options to select whether you want the matches to be case-sensitive, and if you want to allow it to match by combining different text parts together. You can also limit the number of matches and set the similarity threshold.
Once you’re okay with the selections, you can click on OK.
Step 4: Now, open up the and expand the table that has been merged. This will retrieve the matched values.
If everything is matched correctly, you can go ahead and click Close & Load to get the data back into Excel. If there are issues, you may want to go the previous steps to check your fuzzy matching rules, and perhaps adjust the sensitivity of the matches.
Using a Transformational Table to help fuzzy matching
Fuzzy matches don’t always work. In some cases, you’ll need to create a transformational table to help guide Power Query. Here’s an example of when a fuzzy lookup won’t work:
These names are similar looking and there is a big opportunity for overlap. Even when using a low sensitivity threshold, it only matches 3 of the 6 names:
The one way to definitively fix this is to create a Transformational Table for Power Query. What this does is create mapping rules. The table needs to include a ‘From’ column and a ‘To’ column such as this:
Now, when you go back to the Merge Queries dialog and adjust the Fuzzy matching options, you can specify that this is the table you want to use:
Having this table will help Power Query understand which values are related to one another. It eliminates the guesswork and can ensure everything is mapping properly. It requires a bit of extra work but it can save time in the long run. Now when using this transformational table, it matches all of the values correctly:
If you liked this post on How to Do a Fuzzy Lookup in Power Query, please give this site a like on Facebook and also be sure to check out some of the many templates that we have available for download. You can also follow me on Twitter and YouTube. Also, please consider buying me a coffee if you find my website helpful and would like to support it.
Creating a dashboard can be an effective and efficient way to pool in many data points. In this post, I’ll show you how to create a dashboard that factors in several economic indicators, including inflation, interest rates, housing starts, GDP, unemployment, and the performance of the stock market. It will utilize power query and allow you to easily refresh the data.
Creating and collecting the data points
To make the data that I’m dynamic, I will also use a variable for the current date, so that the data will automatically update. In this example, it will be called todaysdate which is equal to the following formula:
=TEXT(TODAY(),"YYY-MM-DD")
Below are the sources for the data that I will use in creating this dashboard along with the Power Query links I will use (along with the variable for the date). I’ll also set up the Power Query links as named ranges in the Excel spreadsheet, making it easy to reference them within the queries.
Using the links above, I’ll create the connections in Power Query and make adjustments where necessary. To reference a named range in Power Query, you can use the following code as an example:
The name is case-sensitive so if you use a named range that is all in lowercase as I have done, then those references also need to be in lowercase in Power Query. However, for the purposes of this example, you don’t need to use named ranges and it is an optional step.
Creating the Power Query connections
To create a Power Query connection, I’m going to start by going into the Data tab and selecting From Web under the Get & Transform Data section. For the unemployment rate data, I’ll use the link for that:
After click on OK, I’ll select the table that I want to use, which is the first one on the list:
I’ll click on the Transform Data button before loading it. What I will do is split the Month column so that I have both a Month and Year field. To do this, I’ll select the column, right-click and select the option to Split by Delimiter and use a space. I’ll also use this opportunity to put in my named range for the data link. In the Power Query window, under the Home tab, there’s an option to click on the Advanced Editor. Here, I’ll enter my NamedRange variable and use that when referencing the Source:
When you’re running a query for the first time, you may see a warning asking you about Privacy Levels. Set these to Public and select Save.
Now it’s time to repeat the steps for the other data sources.
Transforming the data in Power Query
There will be some adjustments that need to be made along the way when loading the data. For example, for the data that comes from the FRED website, there are some rows at the top that need to be removed:
In this case, I’ll need to click the Remove Rows button at the top, and specify that I want to Remove Top Rows and enter a value of 11, to remove the first 11.
For the housing and inflation data, I need to make additional adjustments since the data is raw and doesn’t show the percent change, which is what I want. Here are the steps I’m going to take for those queries:
Unpivoting the data. This is important for the sake of making sure that months are not going across and are instead going vertically. Refer to this post on how to flip and unpivot data in Power Query.
Generating previous and current period data. I’ll create a calculated column to calculate the current period and the previous period. After the current period column is created (by simply joining the month and year together), I’ll duplicate the query so that there is an additional table for the inflation data. As for the previous period, this involves subtracting 1 from the year to get the previous year’s values. Then, the year and month are concatenated:
Doing a lookup of the prior-year period. I’ll now merge the query with the one I copied earlier (the other inflation period). This involves doing a lookup of the previous period on the other table’s current period. The goal here is to get the prior-year period’s value. Here’s an overview of how to merge queries in Power Query.
Calculating the percent change. Once the prior-year period’s value is loaded and on the same row, I can create a custom column to calculate the year-over-year change, which is just the new value / old value -1.
Removing unneeded values. The final steps involve removing any blank values from the inflation rate and removing and periods that contain the word “HALF” indicating half-year values. Lastly, I’ll split the columns back out so I again have the year and month broken out, this time, along with the inflation rate %:
These steps will be similar for the housing data, except I won’t need to unpivot the data since it isn’t broken out by month and year.
Creating the pivot tables and linking to the data
Now that the data is loaded, the next step is to link to it or create pivot tables, to populate the dashboard. For the unemployment data, I will summarize the average by year:
For the GDP tab, I’ll pull in just the four most recent quarters. To do this, I can use the INDEX function and the COUNTA function to grab the furthest values. For the most recent period, I can use the following formula:
=INDEX(A:A,COUNTA(A:A),1)
For more recent periods, I’ll deduct 1, 2, and 3 from the COUNTA value:
The interest rates I will leave as is as that data can chart smoothly given that there normally aren’t many interest rate changes.
For the inflation rate, I will again take the average annual rate using a pivot table but only looking at data since 2010:
On the housing tab, I will break out the average housing starts by quarter, again using a pivot table:
Creating the dashboard
Now that the pivot tables are set up, I can start putting together the dashboard.
For starters, I’m going to go for a clear, dark background, setting it to black. I’m going to create headers for each of the different categories: Unemployment, GDP, Interest, Inflation, Housing Starts, and Stock Market. I’ll link to the key data, referencing the key metric that I want from each tab. Each header will take up three columns, with a space between each one:
What I will also do is create some conditional formatting rules for these values so that they can appear green or red based on their values. Refer to this post for an in-depth overview on conditional formatting. Below the values, I will also extract the date of the most recent data and put it within a formula, to show when the data was last updated:
Next, I’ll create the charts for the different pivot tables. This is really down to preference and style, but I’ll use a combination of bar, column, and line charts to display the data. Here’s how the dashboard looks after adding a title:
And with the data all coming from the web and utilizing Power Query, you can simply just refresh the data to pull the latest numbers, making your dashboard dynamic and easily updateable.
If you liked this post on How to Create a Dashboard in Excel to Track Economic Indicators, please give this site a like on Facebook and also be sure to check out some of the many templates that we have available for download. You can also follow us on Twitter and YouTube.
Inflation has been on the rise and it’s a popular topic these days. In an earlier post, I showed you how to create an inflation calculator to determine what something would have cost in a different year. This time around, I’ll go over how to calculate the actual inflation rate in Excel, showing it as an actual percentage. Let’s get started.
How do you calculate the inflation rate?
If you follow this link to the U.S. Bureau of Labor Statistics, you’ll see a table that has all the latest inflation data. These are indexed values and so to calculate the inflation rate, all you really need to do is take the current index value and divide it by the prior year’s data. For example, September 2022’s inflation rate was 8.2%. To arrive at that, you can simply take the September 2022 index value of 296.808 and divide that by 274.31, which is the value from September 2021. The result is 1.082.
You could download this table into Excel and do a series of lookups to do these calculations. But that’s effectively what I did in the previous post. This time around, I’m going to make this much more automated and involve Power Query.
Download the data using Power Query
First, go to the Data tab in Excel, and click on the From Web button next to Get Data. Then, paste the URL from the link that has the inflation data. Then, you’ll see the Navigator page for Power Query, where you can select from the different tables that are found on the webpage:
Table 1 is the one that contains the inflation data organized by month and year. Before loading this into my spreadsheet, I’m going to make some adjustments so that I can easily calculate the inflation rate right within Power Query. To do that, click on the Transform Data button.
Modifying the data in Power Query
By default the data shows in the following format:
I want the years and months to both be in columns. That means I need to flip the months. To do this, I’ll right-click on the Year header and select Unpivot Other Columns. And then voila, my data is in a more manageable format:
Since I want to compare to the previous year, I’ll also create another column for the previous year. To do this, I can just select the Year column and in the Add Column section, click on the Standard icon that shows different mathematical operators and select Subtract:
The next screen will ask me for the number I want to subtract from each value, which will just be 1. After entering that and clicking OK, I will have a new field, which I will re-name to PreviousYear.
Next, I’m going to create a combined field for the year and month. First, I’ll convert the Year and PreviousYear fields to text. This can be done by clicking on the icon in their headers and selecting Text.
Then, under the Add Column section, I’m going to select Custom Column. From there, I can enter the following formula to concatenate the fields:
I’m going to repeat these steps for the PreviousYear, and that column I’ll call the Previous Period.
Next, I’m going to split this table into two. I’ll rename the current table to Current. Then, I’m going to create a copy of it by right-clicking and selecting Duplicate, and I’m going to call the new table Previous. In the Current table, I’m only going to leave the following columns: Current Period, Previous Period, and Value. While on the Previous table, I’m only going to include the Current Period and the Value.
What I will do next is to merge the tables, where I’ll be looking up the prior period’s value. To do this, I’ll go to the Current table and under the Home tab, select the option to Merge Queries. I’m going to connect the queries with the Previous Period from the Current table to the Current Period in the Previous table. The goal here is to be looking up the prior-year period:
Next, I’ll click on the icon in the newly created column to expand the fields out:
I’m only going to select the Value, as that is the prior value that I want. I’m going to rename that field the Prior-Year Value:
These values shouldn’t be the same and you can easily check to make sure that they are correct. For example, 1914-Jan will show up in both the Current and Previous Periods. And those corresponding values both show 10. Now that I’ve got the current and previous values, the next step is to calculate the percent change. To do this, I’ll create another Custom Column, with this as my calculation:
I’ll then convert the field so that it is in a percentage format, and here is what my inflation rate column looks like:
The only thing left at this point is to clean up the Power Query table to remove any unnecessary columns and values. I will filter out any values that are empty. To do this, I’m going to click on the drop down for the Inflation Rate header and select Remove Empty. This will get rid of the values that didn’t have a prior year value. I’ll also remove all the columns except for the Current Period and the Inflation Rate.
Now that my transformations are complete, I can load this into Excel using the Close & Load button on the Home tab. It will load the Previous table as a new tab, but I can delete that so that I only have the Current table.
Now, moving forward, as the inflation rate data updates, I can just right-click on this table and click Refresh, and Power Query will load the data and calculate the latest inflation rate for me.
If you liked this post on How to Calculate the Inflation Rate in Excel, please give this site a like on Facebook and also be sure to check out some of the many templates that we have available for download. You can also follow us on Twitter and YouTube.
Do you want to do a lookup in Power Query, or just join multiple tables together? In this post, I’ll show you how you can do that. The first thing you need to do is set up each individual query so that it is accessible in Power Query.
In my data set, I have various indicators for countries across the world. In one table, I have the data and the country code:
On another table, I have a list of those country codes and more detailed information about which parts of the world they relate to:
Naturally, I want to combine this information. It’s the equivalent of doing a lookup, except within Power Query. I can do a lookup before populating the data into Power Query, but I can also just merge the queries.
Once you have the queries loaded in Power Query, you can go ahead and start merging them. There is a Merge Queries button on the Home Tab, in the Combine section:
For best practices, you should switch to your main query, the one that holds the data you’ll primarily be using, and then click on the button. By doing this, you can avoid having to adjust the join type. Once you press the Merge Queries button, you’ll see the following options:
The Data query is the initial one that shows up as that is the one I was on when clicking the merge button. I’ll have to select a table I want to merge with (in this case, it will be the one with the country information). After selecting the table to merge with, I’ll also need to highlight the columns that connects the two queries. In this case, it is the Country Code, which I’ve highlighted in both tables:
It doesn’t need to be a one-to-one relationship but if it isn’t, then a single row will end up expanding into more for each match that’s found. The last thing you need to specify before deploying the merge is determining the join kind. There are several options for this:
If you don’t want to lose any data from your main table, then you’ll want to look at one of the first three options. In this situation, where you’re adding data from another table, you’ll either use the Left Outer or Right Outer join. This is where first selecting your main table before clicking on the merge button will make this easier for you. That’s because since it would be the first table, a Left Outer join (the default option) would suffice. In a Left Outer join, you’re keeping all the records from the initial table and only adding matching ones from the second. If your first table is the main one you’ll want to be using, then the Left Outer join will work best. If you didn’t do that, then the Right Outer will be what you want.
When in doubt, look at the description in parentheses to guide your decision to see what each join will do. Once you’ve selected the join type, click on OK. Now, you should see a new column that contains tables for each row:
To expand these tables, you can click on the button in the Countries header, which shows two arrows going in opposite directions:
When you click on that, you’ll be able to select all the fields that you want to extract from the other table:
For this purpose, I’ll only leave the Short Name checked off since I don’t want to make my query unnecessarily large. I’ll also uncheck the tick box at the bottom that by default will leave the original column name as a prefix. After clicking OK, I now have the short name populated in my main query. All that’s left is to move the short name back to the beginning, next to the country code. Now my merge looks complete:
If you liked this post on How to Merge Queries in Power Query, please give this site a like on Facebook and also be sure to check out some of the many templates that we have available for download. You can also follow us on Twitter and YouTube.
Power Query can allow you to easily import data from another spreadsheet. But did you know that you can load multiple files from a folder at once? All you need to do is load the files you want to import into a folder, and Power Query can do the rest. In this article, I’ll show you how you can do this with stock prices and how you can import multiple ticker files from Yahoo Finance into Power Query at once.
Put all the files into a single folder
Whatever type of files you want to import, the key thing is that their format is consistent. This is because Power Query will follow a similar process when importing them. If, for example, you always remove certain columns from a file, then you want to make sure that every file you import has those columns. If there’s a discrepancy, then Power Query may struggle to load the files properly.
In this example, I’m going to use CSV files from Yahoo Finance. Let’s say I want to download data for multiple stock tickers. If I go to Apple’s stock ticker page, there’s a link to download the latest stock prices. In a previous post, I went over how to download stock prices for a single ticker. This time around, I’ll show you how you can do it for as many as you want. If I want to download multiple tickers, I’ll start by downloading all the different CSV files for them and putting them into just a single folder:
Here I’ve got multiple tickers downloaded, including Apple’s. This is now the folder I will reference when extracting the data from Power Query.
Importing the files Into Power Query
In Excel, the next step is to simply download the data. Under the Data tab, click on the Get Data button and select the option for From Folder:
Then, navigate to the folder where your files are stored and click on Open. Now the Power Query window will load and you should see something like this:
Here I see all the files from my folder. There are three different options I can take at this point:
Transform Data. Clicking on this option will allow me to transform the table above.
Load. If I don’t want to make any transformations and just load the table above, this is what I’ll select. But like the above option, this will not combine the data, so this is not what I want.
Combine. This is the option that I will choose as it will combine all these files together. From here, you’ll have the option to Combine and Transform or to just Transform and Load (e.g. if you don’t need to make any adjustments).
On the next screen, you can click on OK and the combined data will be loaded. To make the process as seamless as possible, you’ll want to ensure that your files follow the same format. Otherwise, it can be more difficult to get the desired results.
After clicking on OK, now the data loads, and all my stock data from Yahoo Finance is downloaded, with all the different tickers:
Now, you can add more downloads from Yahoo Finance for different tickers, put them in the same folder, and then just refresh the query. Your spreadsheet will now automatically update based on the CSV files within the folder.
If you liked this post on How to Import Multiple Stock Tickers Into Excel Using Power Query, please give this site a like on Facebook and also be sure to check out some of the many templates that we have available for download. You can also follow us on Twitter and YouTube.
In this article, I’ll show you how you can download the latest prices for cryptocurrencies, along with percent and volume changes. The data will be downloaded via an API from coinmarketcap.com. Once you’ve set up the API, it becomes a breeze to pull crypto prices and data into Excel, in just a matter of seconds.
Getting an API Key
One of the first things you’ll want to do is go onto the website https://coinmarketcap.com/api/ where you can request an API key, which you’ll need if you want to query the data. Once you have the key, you can begin pulling in values. You don’t need to worry about saving or remembering your API key because once you’re logged into the site, you’ll see an Overview section that shows you where you can copy your API key by hovering over that section. On this page, you will also see how many credits you have used today and this month versus how many are available on your plan.
Setting up the connection in Power Query
Once you’ve got your API key copied, you can go into Excel and create a Power Query connection. To do this, go under the Data tab and select the From Web button:
Then, you’ll enter the URL for the API connection, which is https://pro-api.coinmarketcap.com. On the documentation page, you’ll also see a list of possible endpoint paths. Under the basic plan, not all endpoints will be available. In this example, I’m just going to retrieve the latest market data. And for that, the URL is as follows:
I’ll put that into the Power Query URL. However, because the connection requires authentication, I need to check off the option for Advanced rather than just leave the default to Basic. In the section for HTTP request header parameters, you need to enter X-CMC_PRO_API_KEY (you’ll find this on the documentation page) and your API key. Here’s how that looks:
Then, click on OK and Power Query will go to work on creating your connection.
Formatting the data in Power Query
Once loaded into Power Query, you’ll see this:
If you click on the List button next to data, then you will get a series of records:
On the top-left-hand corner, there is an option to convert this To Table. Click on that button, leave the default options on the next window as they are, and then click on OK. We’re still left with a long list of records. For this step, click on the icon highlighted below, at the top of the column:
When the next screen pops up showing you all the columns that will be expanded, click OK. Now you have something that looks a lot more useable:
But there’s still more information that can be extracted. Scroll over to the last column, which should contain the word ‘quote’ in its name. Here there will be a list of records again. And using that button at the top of the field, this can also be expanded. It only has a USD field and once expanded, it looks like nothing has changed. Click on the header button once more, and now you’ll see fields showing volumes and price changes.
Now, you can load the data into Excel by clicking on the Close & Load button. You should now see it populate in your spreadsheet:
Now you can do a refresh at any point in time and your query will pull in the latest data from coinmarketcap.com.
If you liked this post on How to Pull Crypto Prices and Data Into Excel, please give this site a like on Facebook and also be sure to check out some of the many templates that we have available for download. You can also follow us on Twitter and YouTube.
Do you want to change how your Power Query table looks? In this post, I’ll show you how you can flip your data so that you can turn a table that looks like this:
Into this:
In the second table, it’s a bit easier to see all your fields vertically and you don’t need to scroll across to see them all. Depending on how you may want to visualize your data, you may find it useful to swap from one view to the other.
How to transform and flip data in Power Query
To transform the first field into the second field, you’ll need to take two steps in Power Query. The first is to unpivot your data. In this example, I want the order numbers to be as my headers going across, and so I will right-click on that header and select the option to Unpivot Other Columns:
That will result in the table transforming as follows:
This isn’t quite what I need yet, but it’s close, as it has the fields going vertically instead of horizontally. The last part is to put the order numbers going across the top. To accomplish this, I will select that column and choose the Pivot Column option to re-pivot the data again.
Then, on the next screen, it’s important to select the correct values option. And, you’ll also want to select Advanced options and choose Don’t Aggregate:
Now, I end up with a Power Query table that has been flipped and has the order numbers going across and the fields going down vertically:
How to flip the data back
Let’s suppose that you start with the above table and you want to flip it the other way (so that the attributes are going across). Here again, we’ll start with unpivoting the data back. The most important consideration is to know which field you want going across. In this case, it’s going to be the attribute field. Right-click on that and click on Unpivot Other Columns. Then, you’ll see this table:
Now, the next step is to re-pivot the data. Select the Attribute field on the left and click Pivot Column. Again, you’ll need to select the correct value column and choose the option so that you Don’t Aggregate:
And now we’re back to having the order numbers going vertically. Although some of the fields have moved around amidst all those changes, the format is back to how it was at the beginning:
If you liked this post on How to Flip a Table in Power Query, please give this site a like on Facebook and also be sure to check out some of the many templates that we have available for download. You can also follow us on Twitter and YouTube.
Want to create a dashboard to track the stock market and the latest business-related news? Below, I’ll show you how you can create a stock market dashboard using Excel and Google Sheets to pull in all the data you’ll need. If you’d prefer to just download the file, you can do so here.
Step 1: Compiling the data
You can get stock prices into Excel using the STOCKHISTORY function. However, that isn’t available on older versions of Excel and it also doesn’t pull in the current day’s prices. Using Google Sheets can be more effective for this purpose. Plus, on there, I can pull in business-related news as well.
To start, I’m going to pull in values for the Dow Jones, Nasdaq, and S&P 500. I’ll also download the values of a couple of exchange-traded funds (ETFs) that track healthcare and tech stocks. To get the latest price, you can use the built-in GOOGLEFINANCE function that’s only available on Google Sheets. To get the latest value of the Dow Jones, the following formula will work:
=GOOGLEFINANCE(“.DJI”,”price”)
And to calculate the percentage change:
=GOOGLEFINANCE(“.DJI”,”changepct”)/100
For the Nasdaq, you’ll use “.IXIC” and for the S&P 500 the ticker is “.INX”
For the ETFs, since they aren’t indexes, there is no period beforehand and I reference XLK for tech and XLV for healthcare. In my Google Sheets file, I have a simple layout for the values and their changes that I will later pull into Power Query:
Next, I’ll also download the latest business-related news. Google Sheets has another unique function for this: IMPORTFEED. All you need to do is find an rss feed from a website that you want to pull information from. Not every website has an rss feed but what you can do is just do a Google search for the name of a source and ‘rss’ to see if you can find a link. There are three sources I’m going to use for this dashboard:
In Google Sheets, the top articles from each of those rss feeds will show up, including the title, URL, date created, and even a brief summary:
Now, it’s time to pull all this data into Excel.
Step 2: Loading the data into Excel using Power Query
To import data from Google Sheets into Excel, you need to first share the sheet. While in Google Sheets, go into File -> Share -> Publish to web. Then, you’ll be prompted to select what you want to share. I’ll start with the Markets tab I created and then the News tab:
Copy this URL as you’ll need it to load the data into Power Query. While you’re back in Excel, go under the Data tab and click on the From Web button under the Get & Transform Data section. You’ll be prompted to enter a URL. This is where you’ll paste the link that you copied from Google Sheets:
On the next page, select Table 0 as where you want to extract data from. And if you want to do some cleanup (getting rid of extra columns), you can do so by clicking on the Transform Data button:
To remove any unneeded columns in Power Query, just right-click on a column header and click Remove:
Once you’re done, click on the button to Close & Load if you want the data to be loaded on a new sheet. If you want to control where it gets pasted, then use the drop down and select Close & Load To.
Repeat these steps for the other Google Sheets tab.
In addition, I’m also going to load data from a few other sources:
Top 100 Gainers on Yahoo Finance: https://finance.yahoo.com/gainers/?offset=0&count=100
Top 100 Losers on Yahoo Finance: https://finance.yahoo.com/losers?offset=0&count=100
Upcoming IPOs from IPOScoop: https://www.iposcoop.com/ipo-calendar/
The process for importing these links into the dashboard is the same as for Google Sheets. Go through Power Query, import from web, and paste in the URL plus make any formatting changes necessary. The next step involves putting all this data together in a dashboard.
Step 3: Creating the dashboard
In my spreadsheet, I’ve created two tabs: one that hold all my Power Query downloads (the ‘Data’ tab) and a ‘Dashboard’ tab for where all the information will be displayed.
To make the set up of the dashboard easy to manage, I’m going to change the column width to 10 for everything. To do that, press CTRL+A to select all the cells on the Dashboard tab, then right-click on any of the headers, and there you’ll be able to select column width.
First up, I’m going to get the indexes and market indicators as a starting point. To do this, all I need to do is link to the values and the percentages for the S&P 500, Dow Jones, Nasdaq, Tech, and Healthcare tickers I imported from Google Sheets. By default, I’ll set the formatting for all the cells to be green:
To make this more dynamic, I will add some conditional formatting so that if the percentage change is negative, the corresponding cells will highlight in red. For this, I can select all the cells in green above and create a conditional formatting rule the starts with where the first percentage is (in my spreadsheet, it is cell E6):
=E$6<0
This is a simple rule but by not freezing the column (E) and freezing only the row (6), it can be applied to all the cells above. I can apply a red background color so that if any of the percentages are negative, the cells will highlight accordingly:
For the next part of the dashboard, I will copy over the news stories that were also downloaded from Google Sheets. This time, I’m going to use the HYPERLINK function so that I can not just link to the title but also create a clickable link that will allow me to open the story should I want to open it in my default browser. The function itself is simple and involves just two arguments, one for the actual URL and another for what the text should show up. Since it’s shorter, I’m going with the title. After applying some formatting and copying all three sources, this is what my dashboard looks like:
For the last part of the dashboard, I’m going to pull in the tables from the other data sources (top 100 gainers, losers, and upcoming IPOs). If these are on the Data tab, you can just cut and paste them onto the Dashboard tab. And for each one of the tables, I’m going to create a chart based on the symbol and the percent change.
To do this, select the Symbol column and the % Change columns. Then under the Insert tab in Excel, open up the charts and select Treemap. If you selected too many columns or didn’t specify which ones you wanted, you might get a different look. But if you only selected those two, you should see something like this:
Since the chart includes the symbols, the legend can be deleted. Also, I’m going to change the color scheme so that it goes from dark green to light green. This change can be made by clicking the Change Colors button next to the chart:
To add the percentage to each of the boxes, right-click on one of the ticker symbols and click Format Labels. Then, check off the box for value so that the percentages will also show up next to the symbols:
These steps can be repeated for the other charts. However, for the losers table, since the percentage change is negative, it needs to be flipped to positive first. To do that, that query needs to be edited. If you click on Queries & Connections section under the Data tab, you’ll see a list of all your queries. Click on the one that takes you to the top losers query. Right-click edit and Power Query will open up.
Once in Power Query, select the % Change column and under the Transform column at the top, click on the Standard drop down, which will show you all the different calculations you can apply:
Click on Multiply and then for the value in the next box, enter -1. Pressing OK will then flip all the values to negatives.
Now, you can create the same Treemap chart for this table. For the IPOScoop download, the field I’m going to use is Est. $ Volume. This query will also need to be edited in order to use that field since it is text. Although it is a bit more complex since this field contains text and dollar signs, there’s a relatively easy way to parse out what you need.
In Power Query, select the column, and under the Add Column tab, click on the Column From Examples button (choose the option for From Selection):
That will create a new column:
In Column1, I can enter the value that I want Power Query to extract. If I just enter a few values to show what I want (in this case, I only need to enter 300), Power Query fills in the rest, figuring out what I am trying to do. It’s an easy way to parse data in Power Query.
After creating the new column, I can change the format from text to currency by clicking on the ‘abc’ letters in the title:
Now that I have the column created, I can remove the original one and load the data back into Excel and proceed with making a Treemap for this chart using the symbol and the newly created column.
The last thing I’m going to do is create a new column to show the change in volume to determine how much more (or less) trading there was for each stock on the day compared to the average. This will compare the average three-month volume with the current day’s volume. The one complication is that some of the values contain letters:
To convert these values, it’s important to first parse out the letters. If a value doesn’t contain a letter, then it is in thousands. I’m going to set everything to millions. So if the value doesn’t contain a letter, it will be multiplied by 0.000001 to convert it into a fraction of a million. And if it contains a ‘B’, it will multiply by a factor of 1,000. Otherwise, the value will remain as is. Here’s how the first part of the formula will look like, which involves determining the multiplication factor:
Since the letter is always at the end of the string, just using the RIGHT function (which looks at the right-most string) will suffice. This result needs to be multiplied by the remaining value. That value can be extracted by using the SUBSTITUTE function which will replace one value with another:
SUBSTITUTE([@Volume],”B”,””)
In the above formula, the value of B will be replaced with an empty string. This is the same as simply removing the value. To ensure that any ‘M’s are also removed, I will embed this formula within another one that will substitute out those values:
SUBSTITUTE(SUBSTITUTE([@Volume],”B”,””),”M”,””)
I multiply this by the first part of the formula, and my numerator is as follows:
For the denominator, I’m going to use the exact same formula, except instead of the current volume, I’m going to use the field for the three-month average:
The -1 at the end is to put the change in a percentage of less than 100%.
Another step you might consider at this point to help identify these changes is to format these numbers so they are easier to read. You can use conditional formatting (color scales) to easily highlight the highs and lows. And if you want to format the percentages so that they show commas and negative percentages show up red, use the following in the custom number format:
#,##0%;[Red]#,##0%
The semi-colon before the [Red] separates out what the percentages should look like when they are positive (the part before the semi-colon) and what they should like when negative (the part that comes afterward). The [Red] text indicates the value should be in red text.
Here’s how this section looks as part of my dashboard:
And here’s a snapshot of the dashboard as a whole.
One thing to remember: if you want to update the queries and the dashboard, make sure you go under the Data tab and click the Refresh All button. Otherwise, your data may not be up to date.
Also, to prevent your tables from stretching out when updating the queries, select each one of them and under the Table Design tab, click the Properties button (under the External Table Data section), where you should see this:
Make sure the Adjust column width checkbox is unticked. This will prevent your columns from stretching out and disrupting your layout.
If you liked this post on Creating a Stock Market Dashboard in Excel, please give this site a like on Facebook and also be sure to check out some of the many templates that we have available for download. You can also follow us on Twitter and YouTube.
In this post, I’ll show you how you can import a company’s financial statements into Excel using Power Query. Previously, I’ve covered how to get stock prices from both Yahoo Finance and Google Sheets. But to get financial statement information, I’m going to use a different source: wsj.com. The reason being, is it’s in an easy format to export and that makes the import process very easy for Power Query.
Downloading the data
I’m going to use Walmart’s financials for this example. And if you navigate to the following URL, you will get a summary of Walmart’s quarterly financial statements:
What’s convenient about this URL is that it contains both the ticker, the statement type, and indicates that the financials are quarterly. That makes it easy to alter in case you wanted to look for annual statements or a balance sheet rather than an income statement. Just changing the URL will get you to the right page. The above link is what I’m going to use for this example.
To load the data into Power Query, go to the Data tab and click on From Web:
Then, paste the URL in the following box:
After clicking OK, you can select which table to import. In this case, it’s going to be Table 0:
Next, press the Transform Data button to make changes before it gets imported. I’ll start with removing the column at the very end, showing the trend, as it doesn’t contain any information. To remove it, right-click on the header and click Remove:
I’m also going to remove the Changed Type step, which automatically changes the data types. To get rid of the step, click on the X next to the step:
This is important because since the header names change based on the quarter, it isn’t going to be helpful to have this step since it looks for hardcoded values. An optional step you could take is to Demote Headers so that the header names are generic and not tied to a specific quarter. However, this isn’t necessary if you remove the Changed Type step. For more information on changing header names, refer to this post.
Once you’re done making changes, click on Close & Load in the top-left corner, and then your data will load into a sheet.
The download will work just fine right now. However, let’s also make the file a bit more versatile in case you want to quickly change the ticker symbol.
Setting up the variables
First up, I’ll create a named range for the ticker symbol, called ‘Ticker’ :
I’ll now go back into the query editor to account for this named range. To edit a query, go into the Data tab, click on Queries and Connections, and then off to the right you should see your queries. Right-click edit on the one you want to adjust:
Then, click on the Advanced Editor button near the top of the Power Query window:
I’m going to add the Ticker variable under the let section as follows:
Note that Power Query is case-sensitive and you will get an error if what you’ve entered doesn’t match exactly what you’ve set as your named range. Also, make sure to add a comma at the end.
I will also need to adjust the Source variable so that it uses the Ticker variable:
The key thing here is to break up the part of the URL that mentions WMT and replace it with the named range. Here’s what the code looks like within the Advanced Editor:
Now, you can Close & Load back into the worksheet. To test the named range, what you can do is replace the ticker value from WMT to AMZN, and if it works correctly, it should load Amazon’s income statement instead. After changing the ticker symbol, remember to press the Refresh All button under the Data tab:
If it works, you should see a whole new set of data populate on your spreadsheet:
If you liked this post on How to Import Financial Statements Using Power Query, please give this site a like on Facebook and also be sure to check out some of the many templates that we have available for download. You can also follow us on Twitter and YouTube.