calendar7

Task Manager Template: Stay on top of Your Deadlines

Whether you’re managing multiple deadlines, have a lot of tasks, or just have an odd schedule, this task manager template can help you manage all of that. Visually you can see what’s coming up and what still needs to be done. It’s a good way to organize and manage all your responsibilities.


How the Task Manager Template works

I’ve tried apps to track deadlines and tasks and none of them have ever done what I wanted them to do. And since I spend a lot of time in Excel, I thought I’d try to make a task manager template that can be a one-stop shop for managing all of that.

The task manager has four main tabs to it that I’ll go over in detail:

  • Calendar
  • Recurring Deadlines
  • Tasks
  • Team Calendar

Calendar

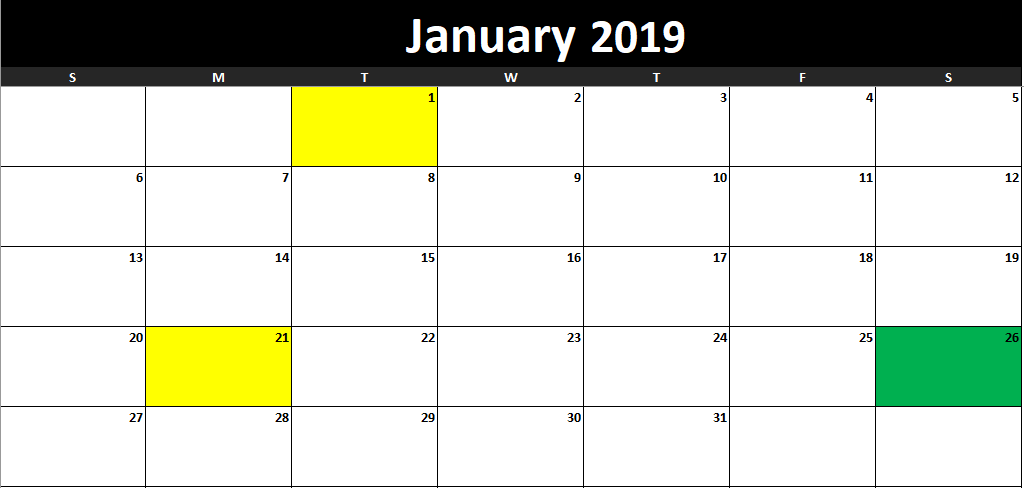
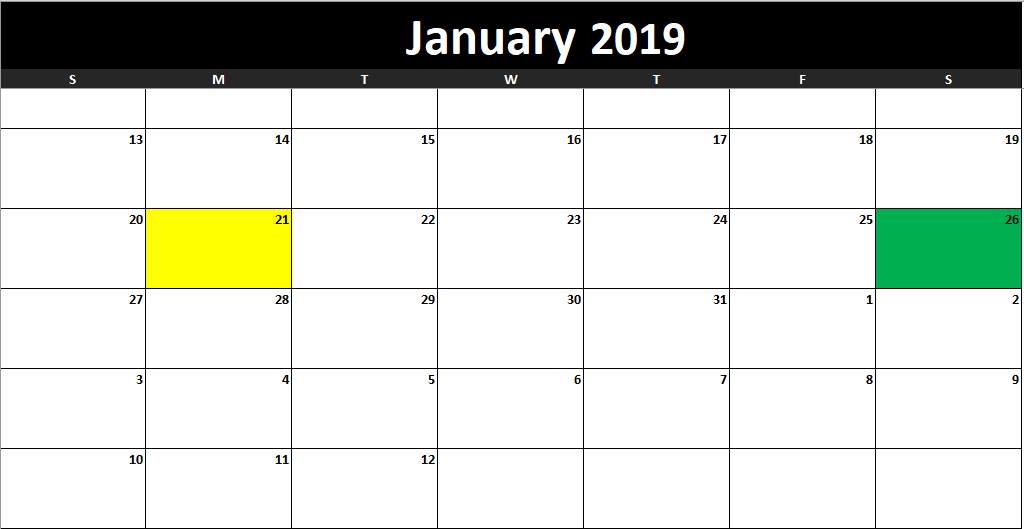
In its simplest form, you can use this tab to generate a calendar for whichever month and year you want just by changing the cell values. The calendar will highlight the current day as well as any holidays that you have specified.

task manager template calendar

It’s pretty simple, but once you start adding tasks and deadlines, it’ll look a whole lot different. I’ll refer back to the calendar as I go as it’ll change as I make updates to the other tabs.

Recurring Deadlines

There are multiple sections in this tab and it really acts as a setup tab, but the deadlines are definitely key.

In the left-hand-side of the page is the month-end schedule. Now, if you’re not an accountant and don’t have to deal with month end, you can probably skip this. However, for accountants that deal with a close process and have deadlines, you can change the month-end date.

month end list

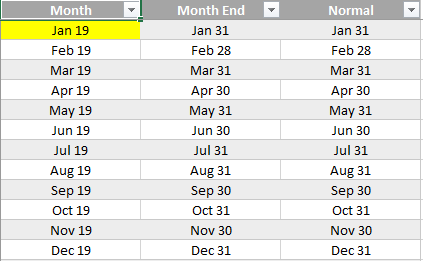
For example, I’m going to change the month-end date for January 2019 to February 12:

month end dates

If I go back to the Calendar tab, even though I’ve selected January, the calendar will continue until February 12:

task manager calendar

You can enter the month-end values for each month so that way each month will cut off where you want it to. If you don’t need a custom end to the month, then the default values will suffice and you they will just end when the month does.

On the right side of the page there is a section for holidays. This is where you can put the non-working days in your part of the world. What you could also do is put any vacation days or time off that you have planned.

holidays

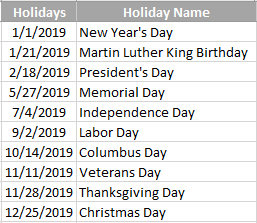
I’ve left a description of the holiday next to it but this is not necessary.

Now, if I go to the middle section of the tab, that’s where I see the recurring deadlines. There are five key fields here: description, occurrence, type of occurrence, day, and next date.

In the description field you’ll want to put in the name of the deadline. If you’ve got multiple deadlines on the same day you’ll want to combine them into one as they will only take up one line on the calendar anyway.

The occurrence and type of occurrence fields will go hand in hand. For example, if your deadline is the first business day of the month, then you’ll put a 1 in the occurrence field and Business Day in the type of occurrence.

If your deadline is the first Monday of the month, then enter a 1 in occurrence, Day of Week in the type of occurrence, and enter Monday in the day field (this is the only time you’ll need to use this field).

If your deadline is always the 1st calendar day of the month, then enter 1 for occurrence and Calendar Day in the type of occurrence field.

There’s an option to just enter a fixed date as well. If you always have a deadline on January 30th of every year, then enter the date in the occurrence field and Fixed Date on the occurrence type. This is helpful if you’ve got property taxes or annual deadlines that you can easily forget about. Of course, you’ll need to remember to update your deadlines.

Lastly, there is an occurrence type for Business Days Before Period End. Before your month end (whether custom or calendar), you can work backwards to compute your deadlines. Let’s say one business day before your cut off date you have to get a report submitted. In that case, you can enter a 1 for the occurrence and select Business Days Before Period End for the type.

Using the above scenarios, this is what my deadlines look like so far:

task manager recurring deadlines

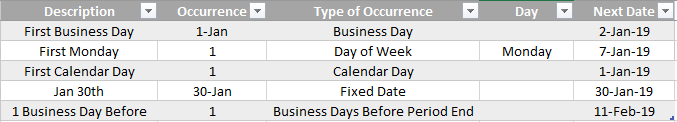
The Next Date field automatically gets populated based on what you’ve entered in the three prior fields.

These deadlines now show up on my calendar:

task manager calendar

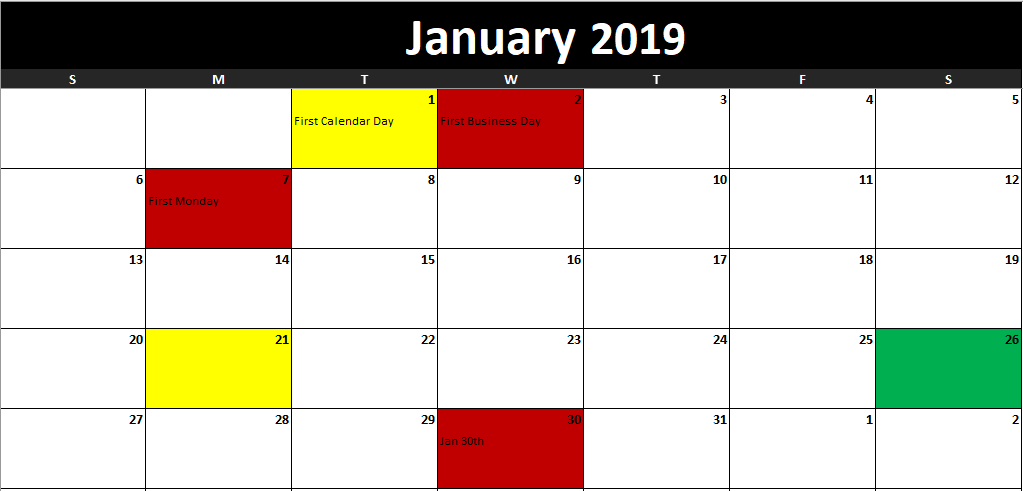
The deadlines are highlighted in red (except where there’s a holiday, as on Jan 1). The description of the deadline also shows in the first line for that particular day as well.

Tasks

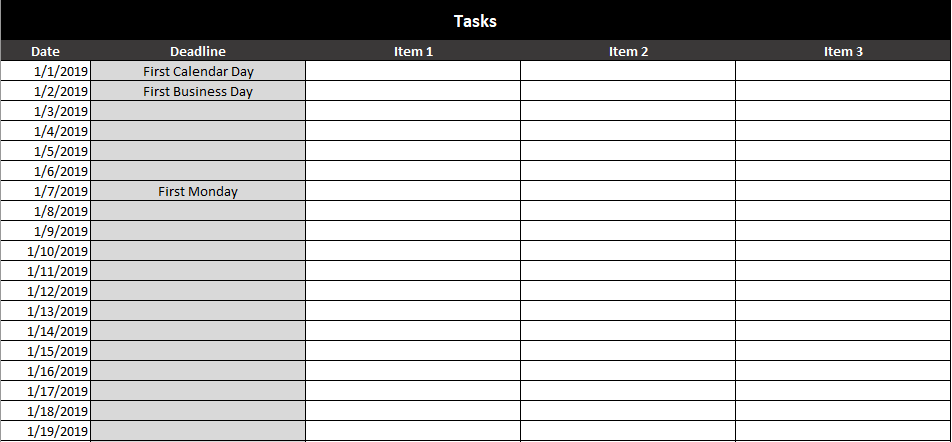
On the tasks tab, you’ll be able to see your deadlines, to do list, and tasks. In the first section, you see the deadlines which we’ve already entered thus far:

task manager recurring deadlines

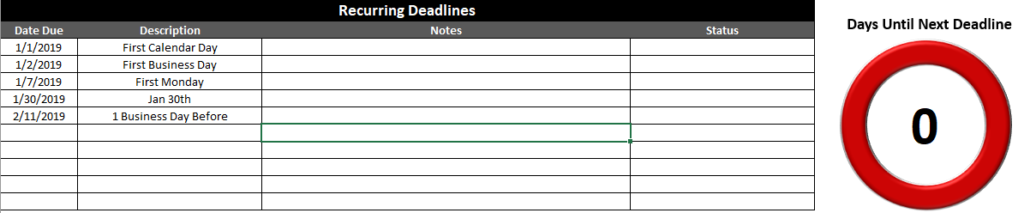
You can add any notes to this section as well as update the status of the deadline. If you haven’t completed deadlines that are in the past, the Days Until Deadline visual will show a zero. However, if I update the status to ‘Completed’ for all the tasks in the past, then my countdown will update to show many days until my next deadline:

task manager status

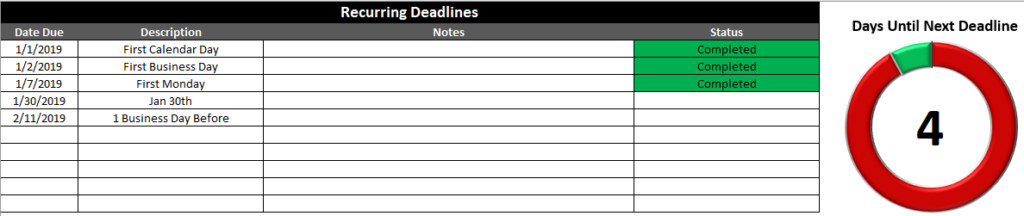
This now gives me an accurate countdown as to how many days away I’m showing until the next deadline.

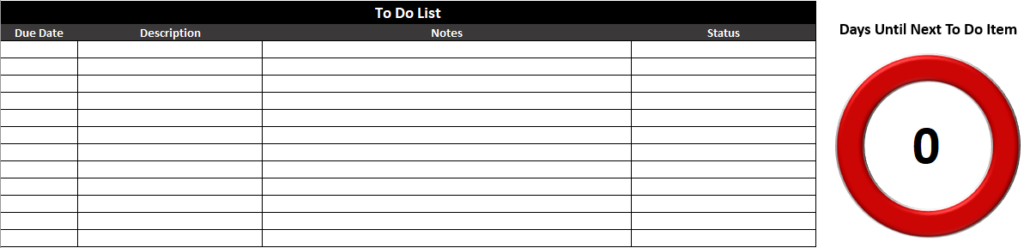
The To Do List won’t show up on the calendar and is just a way for you to track items you’re working on now. It will also show another countdown and is similar to how the recurring deadlines work in this section:

to do list

The last section on this tab is the tasks section.

task manager

This section is important since this is what will show up on your calendar. The deadline column will automatically be the first item on the list. And so you have a limit of three tasks that will show up on your calendar (two if there is a deadline there).

For the first three days of the year, I’m going to put the same three tasks:

tasks

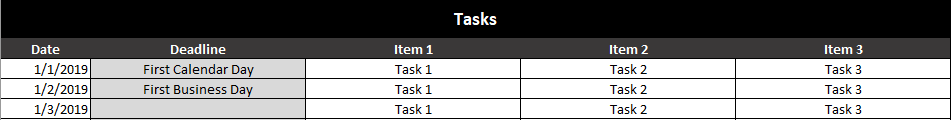
This is how the calendar now looks:

task manager calendar

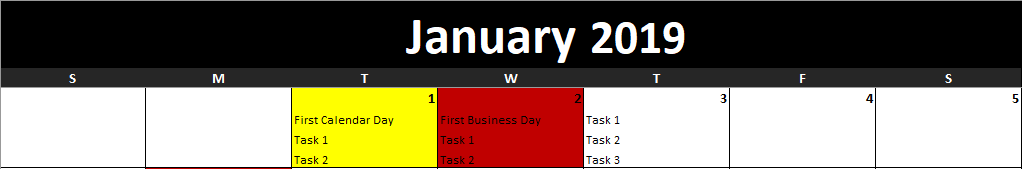
Because the first two days of the year each had deadlines, only Task 1 and Task 2 made it onto those days. On the third day, all three tasks showed up.

Team Calendar

If you’re working on projects or teams, you might find it helpful to have a glimpse as to when people are off.

team calendar

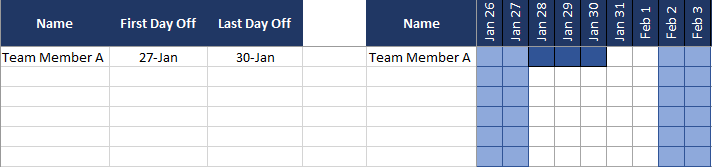
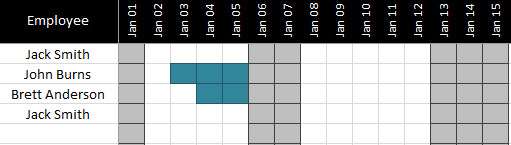
On the left side of the page, you fill in the person’s name and the range of dates that they are off. You can enter in multiple ranges for the same person so the names can repeat.

Next to the actual dates, you’ll want to enter each person’s name that you wish to track (which I’d presume is everyone that is on the left side that you have entries for).

The date will automatically start at today and you’ll see the next 90 days of availability. Any holidays and weekends will be highlighted in light blue. Any time off outside of that will be highlighted in dark blue as in the above example.

Download the Task Manager Template

Free Version – Limit of 10 task and recurring deadlines, contains ads and sheets are locked.

Full Version – 30 recurring deadlines and to-do-list items. No ads and no sheets are locked.

meetinga2

Action Items Template – How to Stay Productive

Excel can be a useful tool for tracking items, whether related to a meeting or a project. The action items template allows you to enter multiple fields related to an action item, including responsible person, department, expected completion, and tags to help organize them.

You’ll be able to create new action items, sort them into different department tabs, recall the ones you want when it’s a new meeting, update the items, and archive them when they’re done.

Let’s start from the beginning.

First, fill out all the fields relating to the action items from your meeting.

action items template

The tags field will help when you recall meeting items in case you only want ones related to sales, a project, or some other criteria. Tags can be separated any way you want – comma, space, or any other separator.

Then, click Save New Items, which will put them into every relevant tab.

action items buttons

By default, I have the sales and marketing tabs setup, but if you need more departments simply copy those tabs. If a tab doesn’t exist for the department, then you’ll get an error and it won’t be able to populate those tabs.

However, you don’t need to have a department for each action item and can simply assign a generic one.

The sales tab now shows the action item:

action items

If a comment is left blank, then it will simply say ‘no update’ was made. In the comment field, it will always show the date of the meeting.

Now, say you want to make a new meeting and want to populate the action items. Click on the New Meeting button. This will give you the opportunity to enter any tags:

action items tags

You can enter up to three different tags in your criteria. This is where if you have a specific type of meeting you can use the tags to help identify which items you want to populate in your meeting list. Of course, this assumes you entered the tag in the action item to begin with. If you do want to include everything, leave the tags blank and just click Done

When you pull up a new meeting it will only recall the most recent comment. Any items that show the completion at 100% will not populate the meeting items.

Any comments you enter now in the Latest Update field will add to the existing comments.

If you have items that are completed and don’t want to see them on the individual department tabs, you can click on the Archive Items button and that will move the items into the Archive tab.

Download the Action Items Template

Download link

Like this template? Give us a like on Facebook and be sure to check out our other templates here

Protect Your Sensitive Excel Data with This Template and Add-in

One of the challenges sometimes with sending your spreadsheet to someone, whether it’s to review or to make changes to it, is that it contains sensitive information.

So I’ve created a template and add-in that will help you accomplish that.

You can download the template here or if you prefer, the add-in is available here.
Disclaimer: I do not offer any guarantees or promises that this will work perfectly and it’s the responsibility of the user to ensure and confirm that all data is adequately protected as the spreadsheet still requires manual steps from the user.

The template will look like a regular spreadsheet, but with one main difference. On the far right end of the Home tab, you’ll see this button:

If you select the data you want to encrypt, whether it’s a few cells or an entire column, then clicking this button will mask your data. Here’s how it works.

In my spreadsheet, in column A, I have a list of customer names that I want to protect.
If I highlight the range and click on the Encrypt Selection button, what will happen is it will mask the data and create a new tab showing me which customer is mapped to which mask:
After all, masking the data is great, but if you don’t know what the data means, it’s not very helpful. The macro creates a tab called “Mapping Hidden Cells” and it’ll give you a popup warning you to delete this tab before you send the data to anyone. The purpose of this tab is to give you the table, and you can either make note of it or save it somewhere. Either way, you’ll want to delete this afterward, otherwise it would make masking the data pointless.
 
If I return to my main tab I notice that the data is now masked:
 
 
The customer names are now nowhere to be found. At this time I’d like to point out that the masking will only happen to the cells that you selected. If for example I had customer data in a different area and didn’t select it, that data would not have been masked.
 
This is why it is crucial for the user to review the data themselves and validate that the sensitive information has in fact been correctly masked, and that the mapping tab has been deleted.
 
 
cashflow

Cash Flow Forecast Template

Download Template

cash flow forecast
 

This template allows you to monitor and forecast out cash flows for a specified number of days. The current date defaults to today’s date but you can override it manually but if you do the formula will be gone.

You can also change the number of days you want to look in advance. For instance, you may only want to look at the cash you expect to have available for the next 7 days, 14, or however long you want.

First you will want to populate the current balance for each of the accounts. Right now they are hard-coded cells but you can certainly add formulas to populate this. The input section is on the second page of the Summary tab (scroll to the right if you do not see it on your screen)

cash flow forecast table
 

The cells above in yellow are ones you can edit. The ones in grey are formulas and need to remain the same as they are used in the chart.

There are three main sections in the chart:
– Funds Available
– Upcoming Transactions
– Outstanding Checks

Funds Available is simply a formula to show what cash on hand is expected at the end of the forecasted days. It looks at the current bank balance, deducts upcoming transactions, as well as the current outstanding checks. A positive number indicates the account will have cash remaining at the end of the period. A negative amount indicates that not enough cash is in the account to accommodate all the upcoming expenses and checks to be cashed.

Upcoming Transactions are populated from the Recurring Transactions tab.

upcoming recurring transactions

You can specify if a recurring transaction recurs monthly or annually. Based on this, along with today’s date, it will calculate the next occurrence of the transaction.

Further down on the Summary tab you can see a breakdown of the largest upcoming expenses on the left-hand side for all the banks and bank-specific transactions on the right-hand side. The yellow cell indicated below can be toggled to another bank and you will see transactions just for that bank. Both of these tables will only show expenses that fall within the date range you specified (e.g. if you specify only the next 7 days, it will only show expenses up until that date).

summary of upcoming and recurring transactions
 

The Outstanding Checks are fueled by the individual bank tabs. Each tab allows you to list any checks you have outstanding along with their amounts. Note that if you change any of the bank names on the input section you will also have to rename the tab. If the tab name does not match the bank name, the checks outstanding will not populate.

mortgage calculator template

Mortgage Calculator – Calculate House Price, Monthly Payment, and Gain or Loss

Download template

This mortgage calculator will allow you to accomplish three different things:

1) Determine the housing price based on a desired monthly payment, interest rate, and terms.
2) Determine the monthly payment based on the price of a house, interest rate, terms, and down payment
3) Calculate the mortgage balance remaining and calculate a gain or loss depending on the selling price you enter.

To select which calculation you are after selecting the option from the drop-down under the ‘Calculate’ header:

mortgage calculator selection
All of the inputs are in yellow cells and can all be changed. Please note that since some of the same fields are used in the different calculators, if you input figures in one cell and change the calculator you will notice the fields won’t reset to 0 but will carry the figures you entered earlier. So you will need to clear or change the amounts in those fields when that happens.


Calculate an Affordable Housing Price

I’ll start with the first example, the Housing Price. In this instance, you want to determine the house price you can afford based on the annual interest rate, term, and how much you want to pay per month. Once you enter your inputs it will tell you the house price that you can afford and if you need additional funds for your downpayment – based on your desired downpayment %

Mortgage calculator house price

In the above example, I wanted to know what price I can afford if I wanted to pay $2,000 a month at a 4% annual interest rate for 30 years. The result was $523,653.10. And since I entered my desired downpayment % as well as how much I had available, it lets me know any amounts I am short for the downpayment. For a house costing $523,653.10, a 20% downpayment would be $104,730.62. Since I put that I have $100,000 available, it tells me that I need an additional $4,730.62 to meet the 20% downpayment.

Calculate the Monthly Mortgage Payment

Next, I will switch over to calculate my monthly payment. In this situation, I specify the house price I want to buy, the amount of the down payment, interest rate, and years

mortgage calculator monthly payment

In this example I set my house price to $500,000; downpayment to $50,000; term again 30 years and interest rate also still 4%. This calculates my monthly payment to be $2,148.37.

Calculate the Gain or Loss on a Sale Price

In my last example, Gain/Loss on Sale has the most variables since it takes into account the price, down payment, monthly payment, the start of the mortgage, selling date, price, and estimated costs. This would be if you wanted to gauge whether you might be looking at a loss or a profit based on the variables entered.

If you’ve been entering these amounts in the previous calculators you will notice some values have carried over, so always be careful to clear the fields first or at least double check the inputs or you may get a result you did not expect.

mortgage calculator gain or loss on sale

For my inputs here I have entered similar values to my earlier examples and now I am calculating whether I will have a gain on the sale if I sell it for $550,000. After commission costs of 20,500 plus closing costs of 11,000 (550,000 x 2%), plus the mortgage balance that remains of 404,966.58, that will leave me with proceeds from the sale of $113,533.42. The gain or loss in this template looks at whether I am walking away with more money than my original downpayment or less. Since my downpayment was $104,730.62, it is a gain on the sale since I am taking more than what I originally put into the house.

These calculators should only be used for estimating purposes and shouldn’t be intended to calculate with 100% accuracy any tax liabilities or other costs. Housing rules vary widely from one region to another so it would be very difficult to factor in every variable. Even mortgage penalties among banks vary in calculation so for the sake of simplicity those variables are taken out of the equation, however, you can estimate a closing cost % and if you want to be conservative you can adjust this % to help account for these variables as you see fit.

amortization template

Amortization Schedule and Summary Template


This template allows you to track multiple amortization / depreciation schedules and summarize them all in one tab. Above is a completed schedule with the inputs (highlighted in grey at the top) filled in. As you can see the last payment will also take care of any balloon payment required. I have made 10 different tabs but you can copy additional ones or delete ones you do not need. Each schedule accommodates up to 1,000 payments by default and assumes monthly payment intervals however this can be adjusted.
 
In the sample file I have three different amortization schedules. If I go to the Summary tab I see the following break:
amortization depreciation summary

The tab names must match to what is written in the Tab Name field otherwise they will not pull correctly. If you update the Current Month field (just enter a date value, do not enter text even though it looks like text) the formulas will update and show you what your balance currently is, how much interest has been paid to date, and how many payments are still remaining. The benefit of this template is if you are managing many different amortization schedules you can get a snapshot of all of them in one tab.

accounts receivable template visual basic excel

Accounts Receivable Statement – Template Using VBA

Download Template

accounts receivable statement

This is an updated version of a prior post that generated a statement without VBA, but the limitation there was you had to save the pdf yourself. This updated version allows you to do the following:

– Save the current statement to PDF
– Cycle through all your customers and save all their statements to PDF
– Generate an email (but not send) to the customer with the attached statement.

It is important to note the customer name on the invoice data needs to match the name on the customer data tab otherwise the invoices will not pull on the statement correctly.

The template works in exactly the same way as the prior version – invoice data and customer data needs to be downloaded from your accounting software. You can customize your statement and include any images you like so that it will look consistent for every statement that you send out.

This template is setup to accommodate up to 150 invoices.

aged accounts receivable chart

Aged Accounts Receivable Chart

Download Template

In this template you can generate a chart showing the history of a customer’s aged accounts receivable. This chart will show a breakdown by invoice age so it will be able to tell you a great deal in one picture: the customer’s total receivables by month, breakdown of the age of the receivables by month, how much sales is being done with the customer (this would be the current receivables), and whether the receivables are growing or declining. It could be a very useful tool in evaluating a customer’s credit worthiness and in helping detect potential problems.

The main input tab is the AllTransactions tab, columns A:E. Column D specifies the type of transaction and should either be PAYMENT or INVOICE. Column C (Date) relates to the date of the transaction – either  payment date or an invoice date. Columns F:H are formulas.

The other input is the Customers tab. You will need to enter all the customers onto here. The easiest way would be to copy the names from all transactions and just extracting unique value (see this post on how to do that). Note that the customer names here must match the names on the AllTransactions tab otherwise when you select a customer data may not populate correctly if the transaction data does not have a match for that customer name.

Once entered, you can go to the Aging Chart tab and select your customer from the drop-down menu and the chart will update:

It is a stacked column chart so in addition to just seeing overall receivables by month you can see their age makeup. This customer did not go past over 30 days so they don’t venture past the dark green shading. Now, my other customer, Bad Customer, has a lot more colour:

This customer has gone as high as 120+ so they have the full spectrum of the aging schedule on here. The closer the colour is to red, the older the receivable is. You can modify these colours to your liking.

The current period that I have the chart running for is from January 2016 until March 2017. You can change the starting period in cell B2 on the Summary tab and if you want to add more months then simply drag the last column’s cells from rows 1 to 8 into the next column so that the formulas will update.

Because there are no macros in this template, you will also need to update the chart range so that it includes the new months you have added. To do so, right-click on the chart and click select data and in the chart data range enter ChartData – this is a named range that will automatically select the furthest column.

 
After you hit OK the chart will update. If you delete columns you don’t need to re-size the chart, this step is only needed when adding additional columns and months


TrackEmployeeVacation

Accrued Vacation and Time Off Template

Tracking employee vacation and time-off requests can be a bit of a headache. This template will help track time off as well as how much vacation has been used up and how much is remaining. It also helps to prepare your recurring journal entries to expense vacation.

How the Vacation Accrual Template Works

This template will help you track and reconcile vacation liability owed to employees. It will calculate this both in hours accrued and taken, and in dollar values if you need to as well.

The first tab is the EmployeeInfo tab which is where you will need to enter your employee information. The Per Day $ and Vacation Rate fields are automatically calculated. Everything else, you’ll need to enter in. In the below example I’ve filled in some sample employee information:

Vacation accrual template showing Employee Info information.

You can replace the data in the table and you can also add rows by just typing the employee name in the next blank row in column A and the table will automatically re-size.

If you do not want to track dollars accrued then you can simply leave the wage field blank. This template will allow you to track vacation dollars and hours even if there are wage or vacation rate changes. In the above example, Jack Smith had a wage of $10 from January 1 until May 31. And from June 1st his wage changed to $15 and vacation rate increased from 4% to 6%. I’ll go over this calculation later in this post to show you that it has calculated properly in the reconciliation tab.

If there are no rate changes you can leave the end date field blank. You only need to use the end date field if the employee has a change in vacation days or wages, or is no longer with the company. In the latter case you will also want to set their status to Inactive. Doing so will exclude them from the JE tab and calculation.

The next section is to ensure the calculation is done correctly and the right percentages are used – daily hours will likely stay as 8 and the annual hours to used in the vacation rate calculation. So if you are paying an employee 4% vacation that is equivalent to 10 vacation days based on 2,000 hours.

Also on this tab is a section to enter the holidays for the year, and this is to ensure that the vacation calculation ignores these non-working days.

The cutoff date is up to what date you want to reconcile to. So if you wanted to know what the vacation liability looks like at the end of the year you would set it to Dec 31, as I have below.

Vacation template with fields for holidays, daily hours, and date cutoffs.

The next tab is the TimeOff tab. This is where you can select when the employee took vacation, and I added an option for sick as well in case you wanted to track that as well.

Time off tab in the vacation tracker template.

In the above example, John Burns is away January 3rd, 4th, and 5th, so I enter the 3rd as the start date, and the 5th as the end date. The next business day would be the day he is back at work. The hours taken reflects the average daily hours from the previous tab. The wage information also comes from that tab.

On the Calendar tab you will see a year-long calendar off the time off. This isn’t part of the vacation calculation but allows you to visually track vacation and sick time taken. 

Chart showing days when an employee is off work.

You see above that the days for January 3,4, and 5 are highlighted for John Burns to indicate he took vacation on these days. Sick days will show in a different colour. Weekends and holidays are also filled in with light grey. This would be more of a scheduling tool when you are dealing with many employees and wanted to minimize time off conflicts and overlaps. 

The Reconciliation tab shows a summary of all of the time earned and vacation time taken off.

Vacation reconciliation showing vacation hours accrued.

You can enter a starting balance if you carry forward vacation from the previous year, and adjustments for any items not captured in the hours earned or time off taken (e.g. vacation pay out). The other cells are formulas and should not be modified.

Verifying the Vacation Reconciliation Calculations

I will refer to my example above where Jack Smith had a change in wage and vacation rate. His wage won’t affect this calculation but his vacation rate will.

From January 1 to May 31 he will accrue at a rate of 4%. Since he works 8 hours a day x 106 working days which fall within this range once holidays are factored in, that is a total of 848 working hours. 4% of this total is 33.92 vacation hours.

The second range is from June 1 until the end of the year (you can adjust the cut-off date in the EmployeeInfo tab). During this range there are 145 working days x 8 hours for a total of 1,160 total hours worked. At his new rate of 6% this is 69.60.

If I total 33.92and 69.60 that gives me 103.52 hours earned which is what the reconciliation shows.

If you track dollars there is a separate section for the dollars accrued which works in the same way.

Again, going back to my example earlier, Jack Smith had a $10 wage from January 1 to May 31st at a 4% vacation rate. If I multiply 106 working days by his daily pay (daily hours of 8 x wage of $10 = $80 per day) then I arrive at 106 x 80 = $8,480. And 4% of this is $339.20.

Now from June 1st to Dec 31st that is 145 working days x his new daily rate of $120 ($15 wage x 8 daily hours) is a total wage of 17,400. And 6% of 17,400 is $1,044.00.

If I add the two amounts together, I get $1,383.20 (1,044.00 + 339.20). As you see this equals the dollars earned for Jack Smith.

Vacation Accrual Journal Entry

The last tab is the JE tab which is used to generate your vacation accrual journal entry.

A vacation accrual journal entry.

You will need to specify the GL accounts, pay period, start, and end dates. There is also a space where you can put an adjustment for an employee. For instance, your accrual might be for a two week period but if someone was terminated or shouldn’t have accrued for any period of time here is where you can make the adjustment.

The employees listed as active will show up in this list as well as their wage during the dates you enter – as long as you don’t have rate changes that occur in the middle of a pay period there should be no issues here.

Please note this spreadsheet should be used to help reconcile to your payroll provider’s data to ensure accuracy and completeness. Do not use this spreadsheet alone in determining your vacation liabilities as I do not offer any guarantees as to its accuracy.

Download the Vacation Accrual Template

Free versionDownload Here. The free version is limited to 4 spots for employees on the EmployeeInfo tab and the sheets are locked and there is an ad in the Excel ribbon.

For the full version (no ads, locks, or limits to # of employees) click on the following button:

nhl2021playoffsmay14

NHL Playoff Tree 2021: Prediction Template

Standings updated as of May 14.

The NHL playoffs are coming soon and so I have set up a template for predictions that you can use.

Download Template

It is fairly straightforward – you select the team you expect to win in each bracket and the number of games. The page can print out easily into one page but the results are also stored in a more data-friendly version in the Results tab.

On the standings tab is where you will find the seeding of the playoff teams. This is important for the purpose of re-seeding the teams that remain in the semifinals.

Once you get to the semifinals, make sure to click the Re-Seed Semifinals button so that the correct opponents are facing each other. If you want to start over, click on the Reset Selections button.