HowtoExcel.net
cropped-h2e100x100.png

HowtoExcel.net

Analytics. Automation. Process Improvement.

  • Home
  • Blog
  • Templates
  • Tools & Calculators
    • Average Down Calculator
    • Compounded Annual Growth Rate Calculator
    • Inflation Calculator
    • Investment Growth Calculator
    • Live T-Account Template
    • Minimum Payment Calculator
    • Money Spent Calculator
    • Mortgage Payment Calculator
    • Mortgage Payment Calculator — Interest Rate Sensitivity
    • Mortgage Payment Sensitivity Calculator
    • Price-to-Earnings P/E Calculator
    • Stock Average Calculator
    • Time Spent Calculator
  • Shop
  • Cart
  • Contact Me

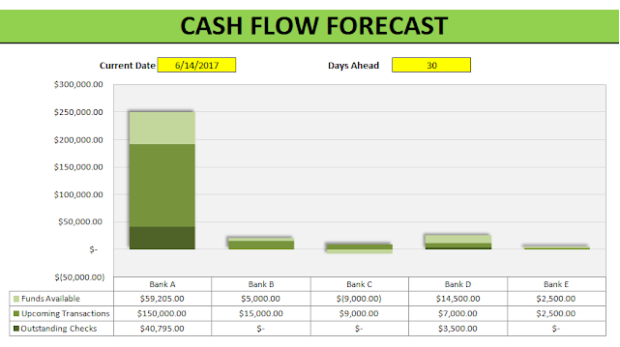
Creating a Dynamic Dashboard in Excel

January 27, 2018
by admin dashboardintermediatepivot chart

Do you want to create a dashboard that will update all of your charts simultaneously based on what filters your users select? Follow the steps below and you can create a professional-looking dashboard without having to use any complex formulas or ...

Read More
2
savecharts3.png

Save a Chart as an Image File

December 19, 2017
by admin chartsvba

Excel has a lot of different charts that you can use to summarize your data with. If you want to use your chart in PowerPoint or Word it's an easy copy and paste job, but suppose you wanted to save the chart as a .gif, .png, or .jpeg file? Then you w ...

Read More
1

Hide Tabs Using VBA to Ensure Users Cannot Unhide Them

September 7, 2017
by admin tips & tricksvba

When you're creating a template in Excel for other users often times there is information in the backend that you'd prefer users not be able to access or modify. In some cases it might be preferable to just hide the data entirely, especially if i ...

Read More
1

Using Slicers in Pivot Tables

August 8, 2017
by admin intermediatepivot tableslicers

I am going to use the same pivot table that I left off with in my last post and now I am going to add slicers to show you how they can make your life easier. ***Please note slicers are a new feature in Excel 2010 and you will not be able to us ...

Read More
2
create pivot table button

How to Create a Pivot Table in Excel

July 20, 2017
by admin intermediatepivot table

In this post, I'll show you how to create a pivot table. It's a key skill in Excel that all users, even beginners, should be familiar with. It can make your analysis a lot easier to do while also presenting your findings in a very easy-to-read forma ...

Read More
0
google sheets start page

Use Google Sheets to Track Stock Prices and News

July 15, 2017
by admin google sheetsinvestingstocks

One of the advantages of using Google Sheets over Excel is that it is easier to access live, dynamic data that you can access from any device that can install the app. Pulling Stock Quotes A great feature of Google Sheets is that you can easily ...

Read More
1
formatcharts.gif

Formatting Charts to Make Them More Appealing

July 5, 2017
by admin chartsformattingintermediate

Excel makes it easy to convert a data set into a chart. The problem is that often the default chart settings aren't the greatest. Below I have some sample data that I will convert into a chart:If I click on the data and go on the Insert tab and ...

Read More
0
parsingdata.png

How to Parse Data to Make it More Useful for Data Analysis

June 28, 2017
by admin advancedparse

In a previous post I have gone over how to use LEFT and MID functions for parsing data, but in this post, I'll go through a specific example from start to finish. I am going to pull my data from the citymayors website, url as follows: http://www.c ...

Read More
1
cashflow

Cash Flow Forecast Template

June 14, 2017
by admin cashflowforecastingtemplate

Download Template This template allows you to monitor and forecast out cash flows for a specified number of days. The current date defaults to today's date but you can override it manually but if you do the formula will be gone.You can also change th ...

Read More
0
conditional formatting new rule

How to Setup Conditional Formatting (including Formulas)

June 7, 2017
by admin conditional formattingformattingintermediate

Conditional formatting is useful for highlighting cells or ranges if a condition is true. For example: highlighting negative values as red or positive ones as green. You can also do more complex formatting like highlighting an entire row if it meets ...

Read More
5
LOAD MORE
LOADING
cropped-h2e100x100.png

HowtoExcel.net

Analytics. Automation. Process Improvement.

© 2019 Company. All rights reserved.  Powered by  Phlox Theme

Shopping Basket

HowtoExcel.net

  • Home
  • Blog
  • Templates
  • Tools & Calculators
    • Average Down Calculator
    • Compounded Annual Growth Rate Calculator
    • Inflation Calculator
    • Investment Growth Calculator
    • Live T-Account Template
    • Minimum Payment Calculator
    • Money Spent Calculator
    • Mortgage Payment Calculator
    • Mortgage Payment Calculator — Interest Rate Sensitivity
    • Mortgage Payment Sensitivity Calculator
    • Price-to-Earnings P/E Calculator
    • Stock Average Calculator
    • Time Spent Calculator
  • Shop
  • Cart
  • Contact Me