guagechart6

How to Make a Gauge Chart in Excel

Whether you’re building a dashboard or just wanting another chart to add to your disposal, the gauge chart is always a popular choice. In this post, I’ll show you how you can create it painlessly and add it to your disposal next time you want to use a chart. It’s especially useful if you’re looking to compare actual vs forecast or need to track a completion percentage

As long as the version of Excel you’re using has a doughnut chart available, you’ll be able to follow these steps.

STEP 1: Set Up the Data for the Gauge Chart

First, you’ll want to set up two columns: one for the intervals and how big the pieces of the gauge chart will be.

For the intervals, normally, what I’ve seen is a 25/50/25 split, meaning the first and last portions are the same size, with the middle being the largest. The column needs to add up to 200, and so the last piece in this example would be 100.

For the second column, this is where you’ll determine where the marker shows up to track your progress or where your actuals come in at.

  • The first number should be 0
  • The second number the percentage; how far on the gauge chart you want the marker to be. This is where you’ll probably want to use a formula as this is the only number that should move on this chart.
  • The third number is how big the marker should be. In this example, I set it to five, and that’s about the highest I’d suggest it should be.
  • The last number is the remainder – here too, you’ll want the total for the column to add up to 200.

Here’s how my columns look right now:

gauge chart table

To move on to step two, create a chart using the Marker and Interval columns (include the labels).

STEP 2: Select the Two Columns and Create a Combo Chart

On the All Charts tab, at the very bottom, you’ll see an option for Combo. The Interval column should be a Doughnut chart while the Marker column should be a Pie chart. You’ll want them on two different axes, so make sure you have Secondary Axis ticked off as well.
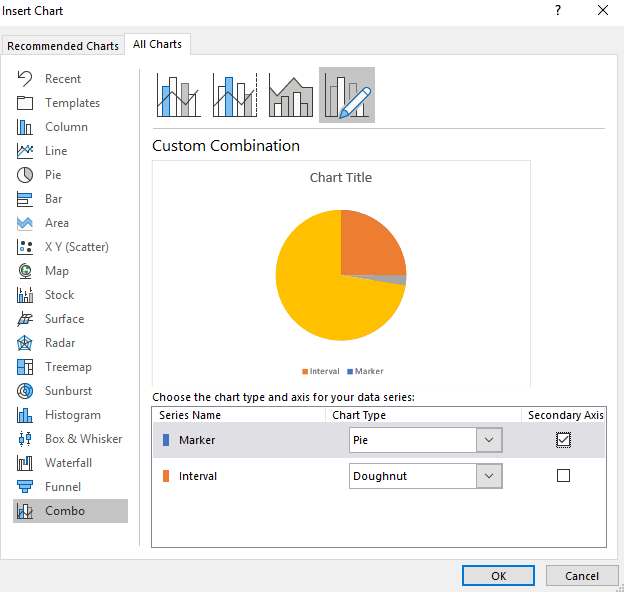
excel combo charts

STEP 3: Format the Data Series on the Charts

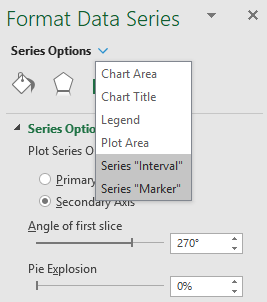
Right click on the chart and select Format Data Series and select Angle of First Slice to 270 degrees. You’ll need to do this for both charts. To switch between charts, click on the Series Options button and select the other series.
series options selection excel

STEP 4: Change the Colors

Using the Series Options from above, make sure you have the Marker series selected. Here is where it gets a little tricky – you’ll need to select every part of the chart and make it blank except for the size of the slice – which you’ll probably want black.

If you have trouble moving across the different parts of the chart, use CTRL + left/right arrow keys to move along the sections. Your chart should now look something like this:

bar chart and doughnut excel

Now, switch over to the Interval series. Here you’ll do the same, except now you’ll be changing the bottom half of the doughnut so that it is blank, and everything else you can change to your liking. In my example, I’m going to go from red to light green to dark green. Here is what the chart looks like after those changes:

gauge chart basic

STEP 5: Additional Formatting (Optional)

You can do any additional formatting to the chart to make it look how you want. In my example, I added a bevel and some shadows to it to make it stand out a little more. I also shrunk the size of the slice to two:

gauge chart excel bevel

Save the Gauge Chart for Future Use

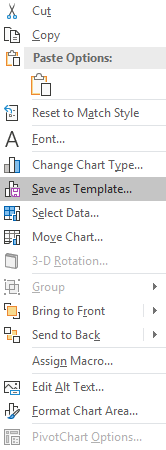
If you like your chart and think you’ll reuse it in the same type of layout, what you can do now is save it as a template. To do that, simply right click on the chart and select Save as Template
excel chart save template

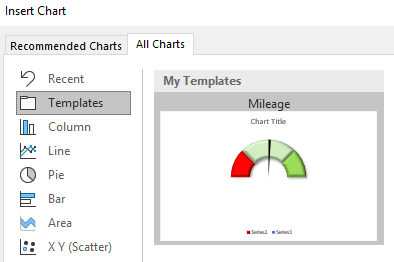
Now, if you have the data in the same format you can go back to insert chart and look for the Templates folder which will now have the saved chart template:
excel chart template

That’s all there is to it! Please let me know if you run into any issues or require clarification on any of the steps above.


If you liked this post on How to Make a Gauge Chart in Excel, please give this site a like on Facebook and also be sure to check out some of the many templates that we have available for download. You can also follow us on Twitter and YouTube.

presentation-1454403_640

How to Make a Correlation Matrix in Excel

To find correlations between data points is useful when you’re trying to find a pattern or any sort of relationship. Below, I’ll show you how you can quickly do a correlation matrix as well as how to do a calculation if you’re only looking at two data sets to compare.

Step 1: Enabling the Data Analysis Add-on

One of the biggest challenges in creating a correlation matrix is just finding where the option to calculate the correlations is. In order to access it, you need to first enable the Data Analysis add-on.

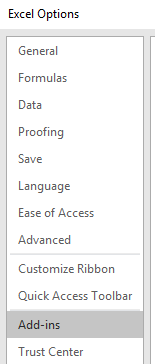
To do this, you have to get to the Excel Options. This will vary depending on which version of Excel you have, but in newer versions, you go to the File tab and select the Options button at the bottom of the page. Once there, you’ll want to select the Add-ins option.

excel options

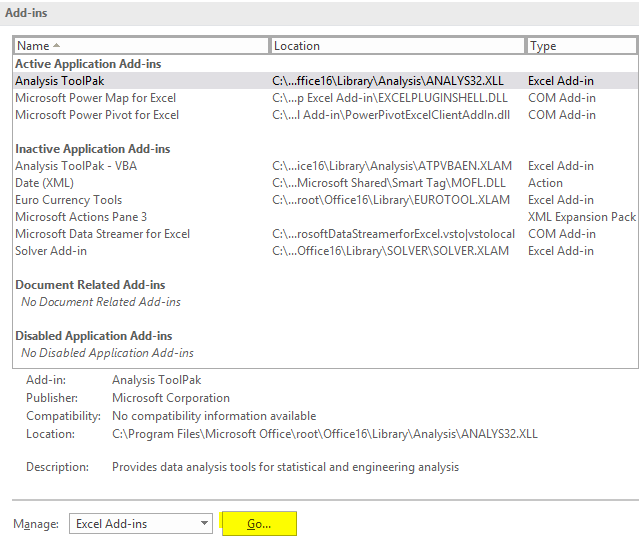
From there, you’ll have a list of all the Add-ins available. Then, next to the Manage button at the bottom, click on the Go button (highlighted in yellow).

excel add-ins

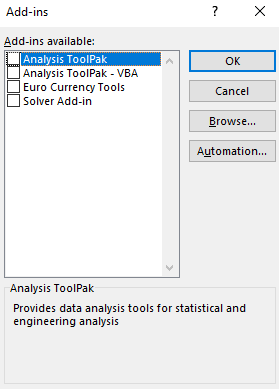
After clicking the button, you’ll have a list of all the Add-ins that you can install.

excel add-ins data analysis

Click on the checkbox next to the Analysis Toolpak and then click OK.

Step 2: Running the Correlation Add-in

Now, if you go onto the Data tab, you should see off to the right, a button for Data Analysis, next to the Outline group.

data analysis group

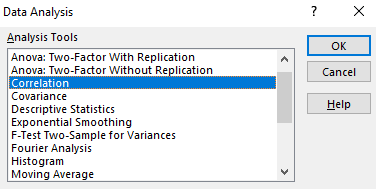
Clicking on the Data Analysis button will give you a lot of different options, but for this example, we’re just going to use the Correlation option.

data analysis correlation

Step 3: Selecting the Ranges to Evaluate

Next, you’ll be asked to select your Input Range. This is where you’ll enter the ranges that you want to compare. You can select either rows or columns. In most cases, you’ll probably leave the default, which is columns. You’ll want to select the columns you want to compare and specify if the label is in the first row.

Once you’ve selected your data along with where you want to output the data (I usually leave the default, which is New Worksheet Ply), then click on OK.

If you don’t have numbers in all your columns, you might see the following error come up:

correlation error

To fix this, you’ll need to look for any blank cells that might be in your data. If you have any if formulas that have a result of “”, then those will cause a problem as well. Either way, your data will need to be cleaned up to ensure that only numbers are in the range that you want to calculate correlations on.

Once you’ve cleaned it up, depending on how many columns you selected, you should end up with something that looks like this:

correlation matrix excel

Step 4 (Optional): Apply Conditional Formatting to the Correlation Matrix

Although the matrix is technically complete, this is not an easy way to identify significant correlations, especially if you’re looking at several columns. This is where conditional formatting can help us.

What I’ll do is setup formatting so that anything between 0.7 and 0.99 shows up as green, and anything that is between -.1 and -.99 will be red to indicate a negative correlation. Now the matrix looks a bit easier to read since I can focus on areas of high or negative correlations:

correlation matrix conditional formatting excel

For a detailed look at how to do conditional formatting, refer to this post.

Recreate a Correlation Matrix Using a Formula

That’s how you can create a correlation matrix in Excel, but what if you just want to look at the correlation between two pairs of data sets? In that case, you can use the CORREL function.

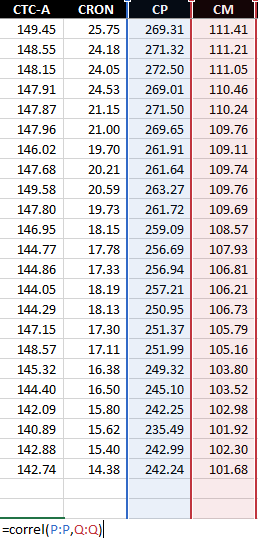
Back to my data set, I can use the CORREL function and select two data sets.

correl function

After hitting enter, it tells me the correlation of the two columns is 0.61. The one limitation of this is that you can only compare two data sets at a time. However, you don’t have to go through data analysis feature and can use this to put the correlation results in any way that you want.

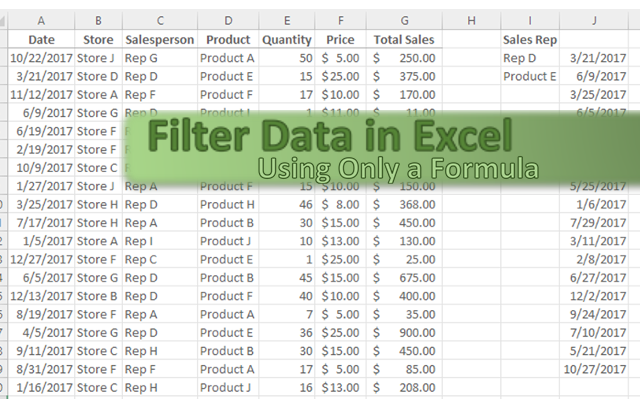
howtofilterdataformulas.png

Dynamically Filter Data Using Only a Formula

In my previous post I went over advanced filters in Excel. This time around I’ll go over how to achieve the same result using just a formula. No macros, no VBA, just through a not-so-simple formula that can dynamically update based on your selections.

I’m again going to use my sample database file for this example. Here’s an excerpt of what that looks like:

Filtering based on one criteria


I’m going to start by filtering all that entries for a specific sales rep.

First, I’m going to use the INDEX function to select the range from where I’m pulling data from.

=INDEX(SampleDatabase!$A$1:$G$1000

For my results, I’m going to want them to show up in the order they appear in the database. For example, in the excerpt above Rep D shows up on lines 3 and 5, and I want that same order to stay intact.

In order to do this, I’m going to use the IF, SMALL and ROW functions, which will be inserted in the INDEX function.

SMALL(IF(SampleDatabase!$C$1:$C$1000=$I$2,ROW(SampleDatabase!$A$1:$A$1000),””),ROW(A1)),1)

$C$1:$C$1000=$I$2 : In this argument, assume that $I$2 is where I have my sales rep name, in this case it would be Rep D. Because I’m only interested in rows that relate to Rep D, this is the main argument that I want to evaluate.

ROW(SampleDatabase!$A$1:$A$1000), “”) : This will return the row number if the above argument is true. It doesn’t matter whether I reference column A, B, C or any other since I’m only pulling the row number. If it isn’t a match, the result will be a blank value.

ROW(A1) : This returns a value of 1, and what this will accomplish is that it will pull the smallest row number from the above list. For instance, for Rep D we know that lines 3 and 5 will be a match, but the smallest number, or the first time that there is a match, is 3. As I drag this formula onto subsequent lines, the row number, because it isn’t frozen, will change and on line 2 it will pull the second smallest row number, on the third line it will be the third smallest, and so on.

The last argument is which column you want to extract. I left it as 1, and that will return the date since that is the first column in my INDEX argument. However, if I wanted to pull the total sales, I could change that to 7, since that would indicate column G, which is the seventh column in the data set that I specified.

The completed formula will look as follows:

=INDEX(SampleDatabase!$A$1:$G$1000,SMALL(IF(SampleDatabase!$C$1:$C$1000=$I$2,ROW(SampleDatabase!$A$1:$A$1000),””),ROW(A1)),1)

This formula will need to be entered as an array, so be sure to hit CTRL+SHIFT+ENTER.

The first five results look as follows:

The one caveat is that if you don’t know how many entries you’ll have and copy the formula down too far, you’ll inevitably end up with #NUM! errors because the formula has not found any more matches. What you can do in this case is use the IFERROR function and include it in the formula:

=IFERROR(INDEX(SampleDatabase!$A$1:$G$1000,SMALL(IF(SampleDatabase!$C$1:$C$1000=$I$2,ROW(SampleDatabase!$A$1:$A$1000),””),ROW(A1)),1),””)

What this will do is now show a blank value if there are no more matches.

Filtering for multiple criteria


While it’s nice to be able to filter for just one criteria, what if you wanted to look for the entries with multiple conditions? Although this makes our already long formula even longer, it is still possible.
Much of the formula stays the same, and the key to making it work is by changing the first argument in the IF statement. Previously, It was only looking for the Sales Rep to be a match:
$C$1:$C$1000=$I$2

I’ll add another criteria, this time for records that include Product E, and I’ll put the product criteria in the cell below in I3. I will add the following to the formula:
$D$1:$D$1000=$I$3
How I combine the two arguments is by multiplying them by one another:
($C$1:$C$1000=$I$2)*($D$1:$D$1000=$I$3)=1

I add the =1 at the end because if both conditions are true then they will result in a 1 value for that line. For example, in the first condition it will look at whether the sales rep is a match, if it is the value will be true (or 1), and if not, it will be false (or 0). The same will happen if the product matches. 
Therefore, if either one of those conditions is false then a 0 will be returned and the two conditions multiplied against one another will not equal 1.
Below is how the new formula looks:
=IFERROR(INDEX(SampleDatabase!$A$1:$G$1000,SMALL(IF(($C$1:$C$1000=$I$2)*($D$1:$D$1000=$I$3)=1,ROW(SampleDatabase!$A$1:$A$1000),””),ROW(A1)),1),””)
You’ll notice much fewer matches in column L (multiple criteria) than in column J where I was only looking for the sales rep to be a match.
If you go back to the original excerpt I showed, you’ll see that for the 3/21/2017 entry, it was for both Rep D and Product E. If I change the values in column I then my calculations will adjust accordingly.

parsingdata.png

How to Parse Data to Make it More Useful for Data Analysis

how to parse data

In a previous post I have gone over how to use LEFT and MID functions for parsing data, but in this post, I’ll go through a specific example from start to finish.

I am going to pull my data from the citymayors website, url as follows:

http://www.citymayors.com/features/capitals.html

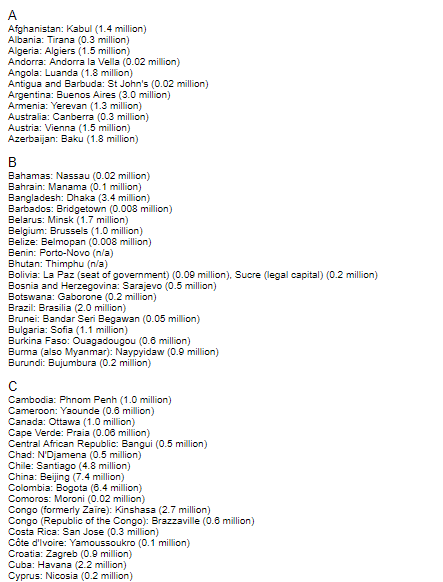
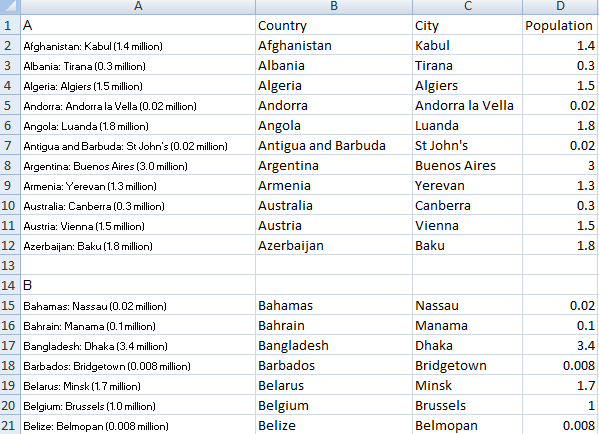
The data on this page looks like this:

original data

At first glance, this isn’t the most useful data that you can paste into an Excel spreadsheet but I’ll show you how it can be made more usable. First off I will copy the entire data set into a spreadsheet.

original data spreadsheet
It copies in much the same as how it looked on the webpage. The problem is it is not in a format that you can do any analysis on. The structure it currently follows is Country: City (population). The more consistent the data is, the easier it is to pull the information out. In this sample, there are some inconsistencies but for the most part, it follows a logical pattern.
I am going to make the following columns: Country, City, and Population.
I’ll start with the Country column. For this field, I can use the LEFT function. However, the country names range in length so I can’t simply take the first x amount of characters. Instead, I have to look at where the colon shows up and stop one character before that.
I am going to start will cell B2 to analyze cell A2. In order to find the colon, I can simply use the FIND function. The formula for this will look as follows:
=FIND(“:”,A2,1)
I insert this formula into the LEFT function so that I get the following
=LEFT(A2,FIND(“:”,A2,1)-1)
What this formula does is look at cell A2, and pull characters until one before the colon (since I don’t want to actually include the colon). I will make one additional adjustment to avoid errors and that is if the cell in A2 is fewer than two characters it will return a blank (rather than an error since it would not find a colon). The formula to check for a length greater than two characters is this:
LEN(A2)>2
Inserted into my earlier formula:
=IF(LEN(A2)>2,LEFT(A2,FIND(“:”,A2,1)-1),””)
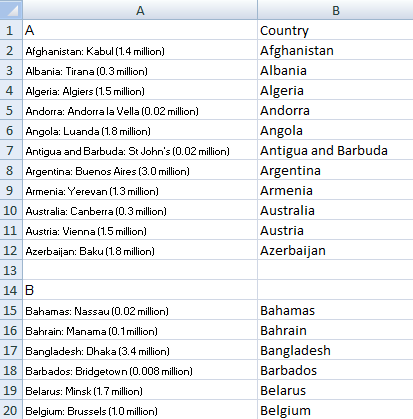
This qualifies the cell first by saying only if it is more than two characters long will my formula try to pull data out, otherwise, it will leave it as blank (“”). I will copy this formula all the way down my country field. This is what my spreadsheet looks like now:
parsing country data
Next up is the City field. This one is going to be a bit more difficult because I can’t start from the left and have to use the MID function where I will need to search for both the colon (my starting point) as well as the bracket that starts the population field (my ending point). In the MID function, I need to specify the start and endpoint, whereas with the LEFT function it started from the first character in the cell.
The first formula I need to make is to get my starting point. But I’ve already done that in the country field, I can just copy the FIND formula from earlier:
FIND(“:”,A2,1)
In this case, I will want to add +2 to the end of it so that it skips over the blank space after the colon and starts at the first character of the city name. My formula currently looks like this:
=MID(A2,FIND(“:”,A2,1)+2
Next, I need to find the endpoint, and similarly, I can use the FIND function to find the opening of the parentheses. The formula for this is similar to my earlier one:
=FIND(“(“,A2,1)
I will want to subtract two characters from this so that I do not include the open parenthesis character or the empty space before it. If I insert this formula into the MID function I now have the following:
=MID(A2,FIND(“:”,A2,1)+2,FIND(“(“,A2,1)-2
The problem with this is finding the ( character does not tell me how long the city field is. To get the actual length of the field, I need to subtract the starting point of the field, which is again using the earlier formula to find the colon. My adjusted formula looks like this:
=MID(A2,FIND(“:”,A2,1)+2,FIND(“(“,A2,1)-2-FIND(“:”,A2,1))
I will add the same qualifier to check for a length of two or more characters. My updated formula:
IF(LEN(A2)>2,MID(A2,FIND(“:”,A2,1)+2,FIND(“(“,A2,1)-2-FIND(“:”,A2,1)),””)
If I copy this formula down my spreadsheet now looks like this:
parsing city data
Next is the population field. Again I will use the MID function and I can use the endpoint of the city field as the starting point for my population field. I am only going to extract the numbers because numbers with text are not useful for analysis. If I wanted to I could pull the million text into another column and then could adjust the numbers accordingly. However, in this instance, it looks like all the figures are in millions so it is not necessary.
My formula starts as follows with the MID function and the previous formula to find the ( character:
=MID(A2,FIND(“(“,A2,1)+1
I added the +1 again so that it starts from the number rather than the ( itself. Next, I need to find the length so I need an endpoint for which I can use the FIND function again. This time I can just look for the empty space that comes after the number. So far I have the following:
=MID(A2,FIND(“(“,A2,1)+1,FIND(” “,A2,1)
The ” ” indicates a blank space. The problem here is I cannot start from the first character because it will find the first space. If the country has a space it will return a value from there, and if not there it will pull the space that comes right after the colon. What I need to do is change the value of 1 to where the ( is found. The updated formula:
=MID(A2,FIND(“(“,A2,1)+1,FIND(” “,A2,FIND(“(“,A2,1))
This will now make sure it retrieves the first space after the ( character, which is what I want. I could have made it simpler and just looked for the word ‘million’ but that would not work for instances where the word did not show up (and I also wanted to show a more complicated example). Next, I need to subtract the starting point so that the length is correctly calculated:
=MID(A2,FIND(“(“,A2,1)+1,FIND(” “,A2,FIND(“(“,A2,1))-FIND(“(“,A2,1)-1)
I deducted one at the end because I did not want to include the space after the number. However, there is still one problem. Even though I extracted a number it is still text. I can convert it to a number simply by multiplying the result by one:
=MID(A2,FIND(“(“,A2,1)+1,FIND(” “,A2,FIND(“(“,A2,1))-FIND(“(“,A2,1)-1)*1
Now the number aligns to the right of the cell, indicating it is a number rather than text (which aligns to the left). I will add my qualifier for the length of the cell:
=IF(LEN(A2)>2,MID(A2,FIND(“(“,A2,1)+1,FIND(” “,A2,FIND(“(“,A2,1))-FIND(“(“,A2,1)-1)*1,””)
Unfortunately the data set is not perfect and in some cases there are text in parentheses so I would want to correct any of those cells – which should be easy to find since they result in errors. Alternatively, I could in the meantime use an IFERROR function to make any errors result in a 0 value:
=IFERROR(=IF(LEN(A2)>2,MID(A2,FIND(“(“,A2,1)+1,FIND(” “,A2,FIND(“(“,A2,1))-FIND(“(“,A2,1)-1)*1,””),0)
Copying the formula to all the cells my spreadsheet now looks like this:
parsing numbers
Using the IFERROR allows you to make the data usable for data analysis. And at the same time because you wouldn’t expect a population to be 0, you can still easily find error cells.
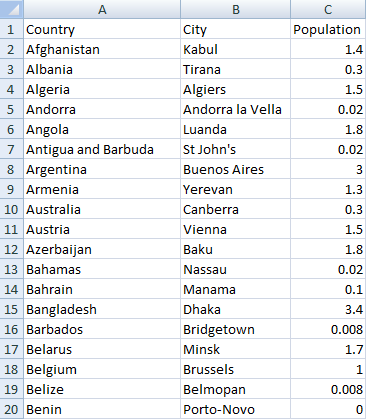
Once you are done parsing your data, I suggest copying and pasting it as values. This ensures you are not dependent on the original data. Once you have done that you can also eliminate any blank values in the Country, City, or Population fields. This will allow you to have an unbroken data set that you can easily filter or use in a pivot table. My completed data set after these changes looks like this:
parsing data for analysis
The key thing to remember is that the original data needs some consistency in it before you can use a formula to be applied to it. If there is no consistency or has a lot variations to it, the more complicated your formula would need to be to pull what you need from it.  In those situations, I prefer to use Visual Basic just because of the complexity that may be involved. This data set was fairly consistent and still involved some long, complex formulas to extract data from it.

Passing Variables in VBA Using ByRef and ByVal

In many cases it is inefficient to run one long sub procedure in VBA. Rather, it is easier to break them up into smaller processes. I’m going to show an example of how to do this using a simple square root function, and having a variable passed from another sub procedure.
My initial subprocedure will just assign a test value, use the square root function to determine the square root, and then return a message box to summarize the results.
————————————————————————————
Sub test()
Dim testvalue as Integer, root as Integer
testvalue = 25
root = sqrt(testvalue)
Msgbox “the square root of ” & testvalue & ” is ” & root
End sub
————————————————————————————
The root variable comes from the sqrt function which is below:
————————————————————————————
Function sqrt(cl as Integer) as Integer
sqrt = cl ^ 0.5
End Function
————————————————————————————
The sqrt function takes the cl to the power of 1/2; its square root.  The sqrt function requires a variable for it to work, which is indicated by the parentheses, indicating that it requires the cl variable to be an integer. That is the key requirement, that the variable passed to the sqrt function is the same data type.
The sub procedure at the top assigns 25 to the testvalue variable.  The next line calls the sqrt function and uses the testvalue variable as the argument for the function. Effectively it is going to calculate the square root of 25. This result will be assigned to the root variable. The last line before the end of the sub procedure simply pops up a message box to say what the square root of the testvalue is.
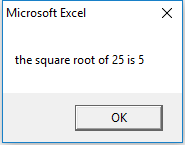
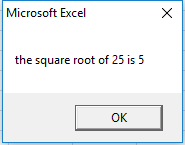
If I run the first sub procedure this is what the message box results in:
As you see the square root of 25 is indeed 5, so the calculation worked correctly.
However, let’s pretend my function has an additional line where it sets the cl variable to 9:
————————————————————————————
Function sqrt(cl as Integer) as Integer
sqrt = cl ^ 0.5
cl = 9
End Function
————————————————————————————
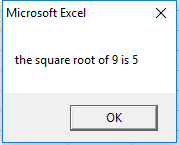
 Now when I run the sub procedure the message box I get is this:
Obviously this is not correct. And you’ll notice that now my variable in my sub procedure has been changed to 9. The reason for this is because the variable has been passed to the function by Reference, or ByRef. As a result, when the sub procedure sends the testvalue variable to the sqrt function, the testvalue variable effectively assumes the cl variable, and when the cl variable is changed to 9, when the variable is now sent back to the sub procedure it is with the value of 9. Sending a variable by reference allows for the variable to be changed by the function. 
The other way to pass a variable is to pass it by Value, or ByVal. Becuase ByRef is the default in VBA, it does  not have to be stated. But to pass it ByVal that needs to be specified. Below is the adjusted function now taking only the value rather than the reference:
————————————————————————————
Function sqrt(ByVal cl as Integer) as Integer
sqrt = cl ^ 0.5
cl = 9
End Function
 ————————————————————————————

 Now when I run the sub procedure I get the following message box:
The calculation reverts back to the correct message I had initially before I added that line of code to change the cl variable. But even with the change in code, by setting the variable to ByVal, it ensures my original variable cannot be changed in the sqrt function. 

Doing Loops in VBA to Highlight Cells and Delete Rows

Doing loops in VBA is very useful because it allows you to go through a range of cells, evaluate each, and then take an action if a specified criteria is met. I am going to go through a couple of examples to show you how you could do this to highlight cells and also delete rows.

For a brief intro to macros check out my earlier post about how to access VBA and record macros.
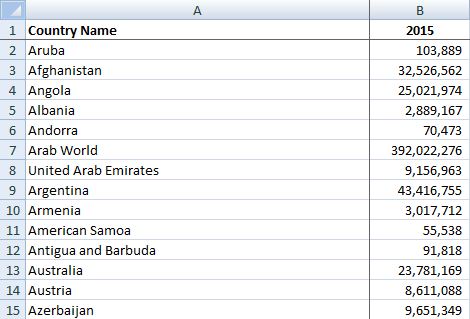
I have a data set below that shows population by country in the year 2015:
First, what I will do is do a loop to evaluate each country’s population for 2015, and for any that had more than 1,000,000 people, highlight the country name in column A.
There are a number of ways to do loops in VBA but I prefer using the For…Each loop. 
The key thing is first to define the range of cells I want the loop to be applied to. I can use Excel’s COUNTA function to count the range. To do so, I first setup a variable called totalcount:

totalcount = WorksheetFunction.CountA(ws.Range(“A:A”))
WorksheetFunction allows me to use Excel functions that are accessible in a normal spreadsheet and are accessible without VBA, in this instance, COUNTA. The totalcount variable now tells me  how big my range needs to be; to what row I need my loop to go to.
I created a couple of additional variables as well: cl – this is the specific cell that will be evaluated when the loop is in progress; ws – this is just the worksheet which allows me to shortcut having to spell out the name of the worksheet each time (in this case it is just the default Sheet1). Below are my variable declarations:
Dim cl As Range
Dim totalcount As Integer
Dim ws As Worksheet
Set ws = Worksheets(“Sheet1”)
totalcount = WorksheetFunction.CountA(ws.Range(“A:A”))
The first line in my loop specifies the range that I am going to cycle through:
For Each cl In ws.Range(“A2:A” & totalcount)
The above can be interpreted as saying that I am going to cycle through each cell from the range A2 until A and whatever the totalcount is equal to. I have to close the loop as well, so the last line of the loop is as follows:
Next cl
The point of the above line is that once I finish evaluating the cell and making whatever changes I need I now move onto the next cell to evaluate.  This variable does not have to be called cl, it just makes it easier to think of instead of next a or b let’s say.
So that is the loop. But without anything inbetween the start and end of the loop all the sub procedure is going to do is go through every cell in that range and do nothing. So as mentioned I want to determine if the population is more than 1,000,000:
    If cl.Offset(0, 1) > 1000000 Then
I use the offset function to evaluate the column adjacent to colum A. I could have selected my range as being B rather than A and I wouldn’t need to do an offset. However, using offset(0,1) tells the procedure to look at the column to the right. Just like the regular excel function, the first argument in the offset function is the number of row offsets, and the second is the column offset. So the above line evaluates if the related value in column B is more than 1,000,000. The next line I enter is what will happen if it is true:
        cl.Interior.Color = vbYellow
This will highlight the cell in yellow. There are a lot of things you can do and in VBA once you type the period after your range, in this case once I enter cl. it will show me a list of properties and methods that I can use. It makes it easy if you don’t remember the exact property or method name:
If I wanted to make the cell bold I would do the following: 
cl.Font.Bold = true
I did not use the offset function here as I want the country field in column A to be highlighted and bolded. My entire sub procedure from start to finish looks as follows:
—————————————————————————————————————–
Sub highlight()
Dim cl As Range
Dim totalcount As Integer
Dim ws As Worksheet
Set ws = Worksheets(“Sheet1”)
totalcount = WorksheetFunction.CountA(ws.Range(“A:A”))
For Each cl In ws.Range(“A2:A” & totalcount)
    If cl.Offset(0, 1) > 1000000 Then
    
        cl.Interior.Color = vbYellow
        cl.Font.Bold = True
        
    End If
Next cl
End Sub
—————————————————————————————————————–
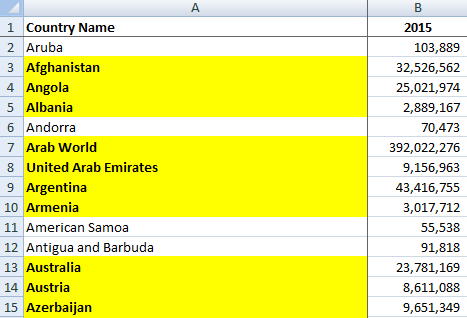
After running the above subprocedure this is what my table now looks like:
I can also use a counter to accomplish the same thing, in which case I don’t use the cl variable
—————————————————————————————————————–
Sub highlight2()
Dim totalcount As Integer
Dim ws As Worksheet
Set ws = Worksheets(“Sheet1”)
totalcount = WorksheetFunction.CountA(ws.Range(“A:A”))
counter = 0
For counter = 1 To totalcount
    If ws.Range(“B” & counter) > 1000000 Then
    
        ws.Range(“A” & counter).Interior.Color = vbYellow
        ws.Range(“A” & counter).Font.Bold = True
        
    End If
Next counter
End Sub
—————————————————————————————————————–
The above code will work in the exact same way as the previous, the only difference is the counter. You’ll see in the below examples why a counter is useful.
Suppose I wanted to delete the rows where the population was less than 1,000,000 people in 2015. I could modify my original code to work as follows:
—————————————————————————————————————–
Sub deleterow()
Dim cl As Range
Dim totalcount As Integer
Dim ws As Worksheet
Set ws = Worksheets(“Sheet1”)
totalcount = WorksheetFunction.CountA(ws.Range(“A:A”))
For Each cl In ws.Range(“A2:A” & totalcount)
    If cl.Offset(0, 1) < 1000000 Then
    
        cl.EntireRow.Delete
              
    End If
Next cl
End Sub
—————————————————————————————————————–
The key difference is instead of bolding and highlighting I have the following line:
cl.EntireRow.Delete
This line will delete the row that the cell is on. If I run this subprocedure, I get the following result:
You’ll notice there is a problem. I have a country that has less than 1,000,000 people in this list – Antigua and Barbuda. It worked in a few instances – it got rid of Aruba, Andorra, and American Samoa. The problem is because American Samoa was right before Antigua and Barbuda. When I delete a row the loop does not factor in that the row that Antigua and Barbuda was on has now moved up a slot so when the loop goes to the next row it has skipped over the one that Antigua and Barbuda is on. So the loop fails in this instance when you run into consecutive rows meeting the condition you have specified.
However all you need to do to correct this is to start your loop backwards: start from the last row and work your way up. To do this I use the counter, The opening line of my loop is as follows:
For counter = totalcount To 2 Step -1
If you recall totalcount is my last row, and it will go until it reaches row 2. Step -1 indicates that it should go up one row at a time (if I wanted it go up two rows at a time it would be Step -2 instead). That way if I delete a row it doesn’t affect my loop since the data above the row I’ve deleted remains the same. My new sub procedure looks like this:
—————————————————————————————————————–
Sub deleterow()
Dim totalcount As Integer
Dim ws As Worksheet
Set ws = Worksheets(“Sheet1”)
totalcount = WorksheetFunction.CountA(ws.Range(“A:A”))
counter = 0
For counter = totalcount To 2 Step -1
    If ws.Range(“B” & counter) < 1000000 Then
    
        
        ws.Range(“A” & counter).EntireRow.Delete
                
    End If
Next counter
End Sub
—————————————————————————————————————–
Now when I run the above sub procedure I get the following result:
Now you’ll notice Antigua and Barbuda is now gone and my list only contains countries with populations of more than 1,000,000 people. 

Custom Function: Extract All Matching Data

The purpose of this function is to act as multiple vlookups to pull all data that has multiple matches, and allows the user to specify how they want the data delimited

The function is called EXTRACTALL and it has four arguments:
Argument 1: Looup Field. This is the value that you are looking for. If it is text, make sure it is in quotes
Argument 2: Lookup Range. The range the function is going to search to find the value specified in argument 1
Argument 3: Output Range. If a match is found in the lookup range, this is what will be returned. The ranges should be the same length
Argument 4: Separator. This is how the results will be separated.

An example of the formula is below:

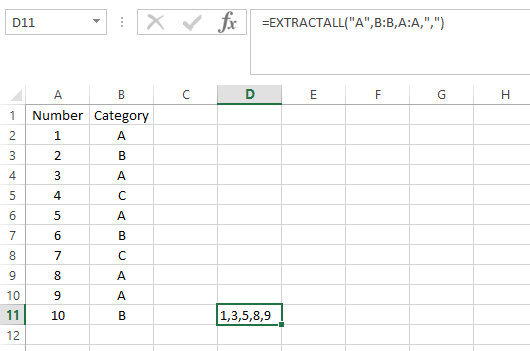
=EXTRACTALL(“A”, B:B,A:A,”,”)

This will look for the letter A in column B, and when there is a match the value from column A will be pulled. All values will be separated by commas.

You will note the values that correspond to A’s are 1, 3, 5, 8, and 9 which is what the result displays in cell D11. This acts effectively the same as a lookup function might with the difference being this will pull every match and put it into one cell whereas a lookup will just grab the first match and nothing else. This is more useful in the case of text values because after using this formula (especially if a comma separator is used) you can convert from a comma delimited field into multiple fields.

Below is the code:

Function extractall(lookupfield As String, lookuprange As Range, outputrange As Range, separator As String)

Dim cl As Range
Dim counter, offsetcol As Integer

counter = 0
extractall = “”


offsetcol = outputrange.Column – lookuprange.Column


For Each cl In lookuprange

    If cl = lookupfield Then
        counter = counter + 1

            If counter > 1 Then

               extractall = extractall & separator & cl.offset(0, offsetcol)
            ElseIf counter = 1 Then

                extractall = cl.offset(0, offsetcol)
            Else

            End If
    End If

Next cl

End Function

Pivot Tables: Avoid Changing Data Sources with Named Ranges

When working with a pivot table, you determine a data source to use for that table. But what if later you add rows or columns? You’ll normally have to change the data source to include the updated range, otherwise your pivot table isn’t including your changes. Unless you use a named range.

First, select the Name Manager under the Formulas tab and click on New

However, instead of selecting all the data, I’ll use the offset formula.

The OFFSET function allows you to specify the size of your data set. The formula below will keep the range equal to all the nonblank rows and cells starting from cell A1:

=OFFSET(Sheet1!$A$1,0,0,counta(Sheet1!$A:$A),counta(Sheet1!$1:$1))
This is the first cell of your data source

This is the first column of your data source

This is the first row of your data source

Once you’ve created a new name for your data set, put the formula above in the Refers to field and press OK:


Now you’ve created your custom, auto-updating range. All you need to do now is when creating a pivot table (or changing its data source), put in the named range.

Note this will not work properly if you have gaps in your columns or rows. The COUNTA function counts how many non-blank cells are within the range. So you could manually override the formulas if need be, but that would defeat the point of this post.

But if you follow the above steps and use the formula above, your pivot table will automatically be updated with any new rows or columns you add to it. All you’ll have to do is refresh the pivot table. And because the offset formula forces the range to change, that will automatically happen in the pivot table as well.

Formula to find day of week occurrences in Excel

In my previous post I showed a function that can help pull a certain instance of a day of the week using VBA. In this post, I’ll show how to do that without VBA. Specifically, three things this post will look at: 1) how to find the first Monday of the month 2) how to find the date ending/starting of a week, and 3) how to find the 3rd Monday of the month

1.Finding the first Monday of the month

First, I need to identify the weekday that the first day of the year falls on with this formula:

Formula 1.A

=WEEKDAY(DATE(2014,1,1))

This returns 4 (Wednesday). 

Next I’ll determine how many days away this is from my desired day – Monday. Since Monday is the 2nd day of the week, the first day of the year is 2 (4-2) days after Monday. If you want to use another day instead of Monday then change the 2 to the corresponding day of the week (for example, Sunday is 1 – assuming your settings are setup for weeks starting on a Sunday). 

With 7 days in a week, I need to deduct 2 from 7, making 5 days that I need to add to the first day of the year to get to the first Monday of the year. The formula so far looks like this:

Formula 1.B

=DATE(2014,1,1)+7-(WEEKDAY(DATE(2014,1,1))-2)

However, this formula will only work if the first day of the month falls after Monday. I need to include an IF statement so that in the case that Monday (or whatever day I choose) falls after the first day of the year, it will just add the difference. The formula that follows includes this consideration:


Formula 1.C

=DATE(2014,1,1)+IF(WEEKDAY(DATE(2014,1,1))-2<=0,2-WEEKDAY(DATE(2014,1,1)),7-((WEEKDAY(DATE(2014,1,1))-2)))

(the numbers highlighted in red relate to the day of the week I want to calculate)

This formula is a bit more complex but all it is saying is that if the difference between the days of the week are negative (e.g. first day of the year is Sunday and hence before Monday) then I would just add the difference to the first day of the month. Otherwise the formula remains as it was.

I’ve replaced all the possible variables with words so you can easily see where to change the values to calculate to the day you want.


Formula 1.D

=DATE(YEAR,MONTH,1)+IF(WEEKDAY(DATE(YEAR,MONTH,1))-WEEKDAYNUMBER<=0,WEEKDAYNUMBER-WEEKDAY(DATE(YEAR,MONTH,1)),7-((WEEKDAY(DATE(YEAR,MONTH,1))-WEEKDAYNUMBER)))

2. How to find the 3rd Monday of the month

Continuing from Formula 1.D, I’m going to make an adjustment to calculate the proper week. To do this I need to add two weeks to the formula:

Formula 2.A

=DATE(YEAR,MONTH,1)+((XTHOCCURRENCE-1)*7)+IF(WEEKDAY(DATE(YEAR,MONTH,1))-WEEKDAYNUMBER<=0,WEEKDAYNUMBER-WEEKDAY(DATE(YEAR,MONTH,1)),7-((WEEKDAY(DATE(YEAR,MONTH,1))-WEEKDAYNUMBER)))


Where XTHOCCURRENCE in this case will be equal to 3.

If your result is a number you will need to change the cell format (CTRL+1) to date.


3. Find the date ending/starting of a week

If you have weekly reporting and reference a week number, you may find it useful to show what date that week relates to.

This formula builds off of Formula 1.D. One difference is the month will always be set to 1 because we need to know the first weekday of the year. This is important to determine the number of weeks that need to be added.


If the first day of the year falls after the day I want (this example is Monday), then I know the first Monday will fall in week 2, not in week 1. What that means is if I want to determine the Monday on week 15, I will need to multiply by 13 and not by 14 weeks to get to that date. The formula is:

Formula 3.A

=DATE(2014,1,1)+IF(WEEKDAY(DATE(2014,1,1))-2<=0,(15-1)*7+2-WEEKDAY(DATE(2014,1,1)),(15-2)*7+7-((WEEKDAY(DATE(2014,1,1))-2)))

The only parts I added were those in purple, which just multiply the number of weeks I need. This formula will work for any day of the week. So if you want to calculate the the start or end of week 15, you can set the weekday you are calculating to as Monday (2) or for the end of the week to Friday (6). Here is the formula with the variables replaced with words:

=DATE(YEAR,1,1)+IF(WEEKDAY(DATE(YEAR,1,1))-WEEKDAYNUMBER<=0,(WEEKNUMBER-1)*7+WEEKDAYNUMBER-WEEKDAY(DATE(YEAR,1,1)),(WEEKNUMBER-2)*7+7-((WEEKDAY(DATE(YEAR,1,1))-WEEKDAYNUMBER)))

The weekday number relates to the day of the week (e.g. 1-Sunday, 2-Monday, 3-Tuesday, 4-Wednesday, 5-Thursday, 6-Friday, 7-Sunday). This may be slightly different depending on your regional settings, you may have Monday set as 1. The weekday number is the day of the week that you’re interested in determining where it falls.

Find the xth occurrence of a day in a month

This function is called dayx. It consists of the following arguments: occurrence number, day of the week, month, year. For example:

dayx(2,”Monday”,10,2014)  or dayx(2,1,10,2014) will return the second Monday of October 2014, which is October 13, 2014

For information on how to insert a custom function, see this post.

Here is the code for this function:
———————————————————————————————————————–

Function dayx(xoccurrence As Long, xday As String, xmonth As Long, xyear As Long)


Dim firstweekdayofmonth As Long
Dim currentmonth, endofmonth, firstdayofmonth As String


Select Case UCase(xday)
    Case Is = “MONDAY”
        xday = 1
    Case Is = “TUESDAY”
        xday = 2
    Case Is = “WEDNESDAY”
        xday = 3
    Case Is = “THURSDAY”
        xday = 4
    Case Is = “FRIDAY”
        xday = 5
    Case Is = “SATURDAY”
        xday = 6
    Case Is = “SUNDAY”
        xday = 7
End Select

‘Convert month number to name
currentmonth = Format(DateAdd(“m”, Val(xmonth) – 1, “January 1”), “mmmm”)
endofmonth = Format(WorksheetFunction.EoMonth(Format(DateAdd(“m”, Val(xmonth) – 1, “January 1”), “mmm dd, yyyy”), 0), “mmmm dd, yyyy”)

‘Determine the first day of the month
firstdayofmonth = Weekday(currentmonth & ” 1, ” & xyear, vbMonday)

‘Calculate
If xday >= firstdayofmonth Then
dayx = Format(currentmonth & ”  ” & (7 * (xoccurrence – 1)) + 1 – (firstdayofmonth – xday) & ” , ” & xyear, “mmmm d, yyyy”, vbMonday)
Else
dayx = Format(currentmonth & ”  ” & 7 + (7 * (xoccurrence – 1)) + 1 – (firstdayofmonth – xday) & ” , ” & xyear, “mmmm d, yyyy”, vbMonday)
End If

dayx = Format(DateAdd(“m”, 0, dayx), “mmmm dd, yyyy”)

End Function

———————————————————————————————————————–