HowtoExcel.net
cropped-h2e100x100.png

HowtoExcel.net

Analytics. Automation. Process Improvement.

  • Home
  • Blog
  • Templates
  • Tools & Calculators
    • Average Down Calculator
    • Compounded Annual Growth Rate Calculator
    • Inflation Calculator
    • Investment Growth Calculator
    • Live T-Account Template
    • Minimum Payment Calculator
    • Money Spent Calculator
    • Mortgage Payment Calculator
    • Mortgage Payment Calculator — Interest Rate Sensitivity
    • Mortgage Payment Sensitivity Calculator
    • Price-to-Earnings P/E Calculator
    • Stock Average Calculator
    • Time Spent Calculator
  • Shop
  • Cart
  • Contact Me

Euro2024Template

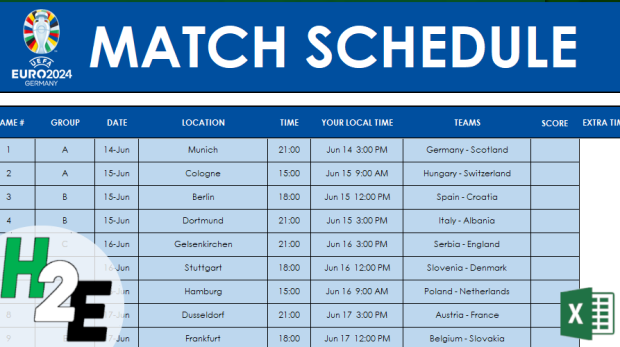
Free UEFA Euro 2024 Prediction Template and Schedule

April 8, 2024
by howtoexcel template

The UEFA Euro 2024 tournament is beginning in June 2024. And whether you want to track the games, make predictions, or just print out a schedule that highlights the games you want to track, this template has you covered. Below, I'll go over how the ...

Read More
MultipleLineChartsGrowthvsActual

Create Multiple Line Charts in Excel Showing Actuals and Growth Rates

April 1, 2024
by howtoexcel charts

A line chart in Excel can be a great way to display a time series in Excel. But did you know that you can show a series' actual values along with the year-over-year growth rate, or change? By using a second axis and adjusting the scales, I'll show y ...

Read More
StaticDateStamps

Adding Static Timestamps in Excel Using Checkboxes

March 26, 2024
by howtoexcel checkboxescircular referencedata entry

One way to enhance your spreadsheets is by adding checkboxes. Using checkboxes, you can make data entry easier for your users. And you can create formulas based on whether a checkbox is checked off or not. In the latest version of Excel, using Micro ...

Read More
ProgressChart

Create Progress Charts in Excel

March 19, 2024
by howtoexcel chartsfinancial analysis

Whether you're managing projects or working towards a goal, visualizing progress is important to ensure you're on track for meeting your target. And by using charts in Excel, you can easily track your progress, making it easy for you to view and sha ...

Read More
Amortization calculator which calculates values for a specific period.

Create an Amortization Calculator in Excel

March 12, 2024
by howtoexcel accountingamortizationcalculator

Amortization schedules are essential tools for anyone managing a loan or mortgage, providing a clear breakdown of how payments are allocated towards interest and principal over the loan's term. Typically, these schedules detail each payment's date, ...

Read More
MovingAveragesinExcel

What Is the Difference Between a Moving Average and an Exponential Moving Average

March 5, 2024
by howtoexcel averageinvestingstocks

Moving averages can be useful in data analysis, when looking at trends both in finance and in the stock market. You can look at 30, 60, 90 day trends, and even longer or shorter durations. There's also a difference between whether you are looking at ...

Read More
StockTradingTemplate2024

2024 Stock Trading Template

February 27, 2024
by howtoexcel investingstockstemplate

Do you buy stocks? Help track your transactions and your returns with this stock trading template. This is an update over the previous stock trading template, offering more reports and analysis, and the ability to more easily track your portfolio's ...

Read More
WeeklySalesReports2

Compare Weekly Sales in Excel Using a Pivot Table

February 20, 2024
by howtoexcel analysisfinancial analysispivot table

Do you need to create weekly sales reports that compare the same days of the week? This kind of analysis can be tricky to ensure that you are comparing the same day of the week against the same week in the previous year. Simply comparing dates may n ...

Read More
PEGRatio

How to Calculate the PEG Ratio in Excel

February 13, 2024
by howtoexcel conditional formattingformattinginvesting

What is the PEG Ratio? The Price/Earnings to Growth (PEG) Ratio is a metric that enhances the traditional price-to-earnings (P/E) ratio by incorporating the company's earnings growth rate into the calculation. This ratio is calculated by dividing ...

Read More
RunningTotalsinPQ

How to Calculate Running Totals in Power Query

February 6, 2024
by howtoexcel functionspower query

Do you have year-to-date values and need to calculate running totals? What about if you have criteria you want to track running totals for? In this post, I'll show you how to accomplish both and how you can create a custom function in Power Query th ...

Read More
LOAD MORE
LOADING
cropped-h2e100x100.png

HowtoExcel.net

Analytics. Automation. Process Improvement.

© 2019 Company. All rights reserved.  Powered by  Phlox Theme

Shopping Basket

HowtoExcel.net

  • Home
  • Blog
  • Templates
  • Tools & Calculators
    • Average Down Calculator
    • Compounded Annual Growth Rate Calculator
    • Inflation Calculator
    • Investment Growth Calculator
    • Live T-Account Template
    • Minimum Payment Calculator
    • Money Spent Calculator
    • Mortgage Payment Calculator
    • Mortgage Payment Calculator — Interest Rate Sensitivity
    • Mortgage Payment Sensitivity Calculator
    • Price-to-Earnings P/E Calculator
    • Stock Average Calculator
    • Time Spent Calculator
  • Shop
  • Cart
  • Contact Me